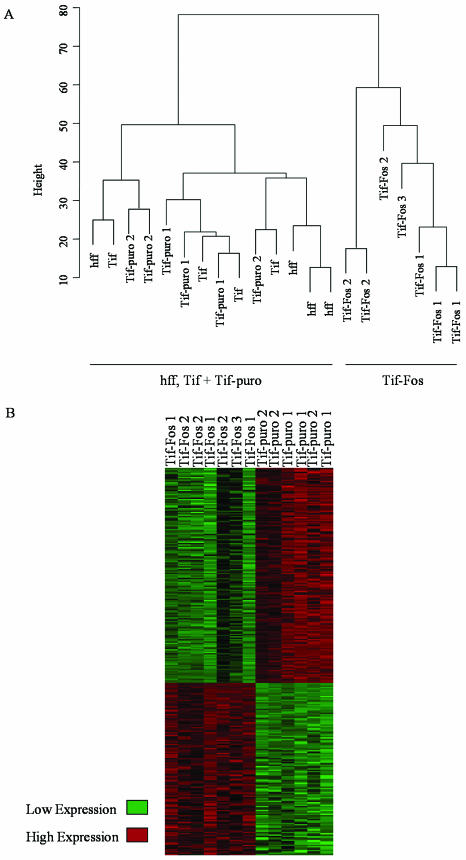
FIG. 6.
Gene expression profiling. (A) Cluster dendrogram of all samples: hff (×4), Tif (×4), Tif-puro (×6), and Tif-Fos (×7). The metric used was Euclidean distance, and clustering was done by the “complete” method as implemented in the “mva” library in the “R” statistical software. (B) Statistically significant changes in gene expression assessed by SAM for all Tif-puro samples (×6) and all Tif-Fos samples (×7).

