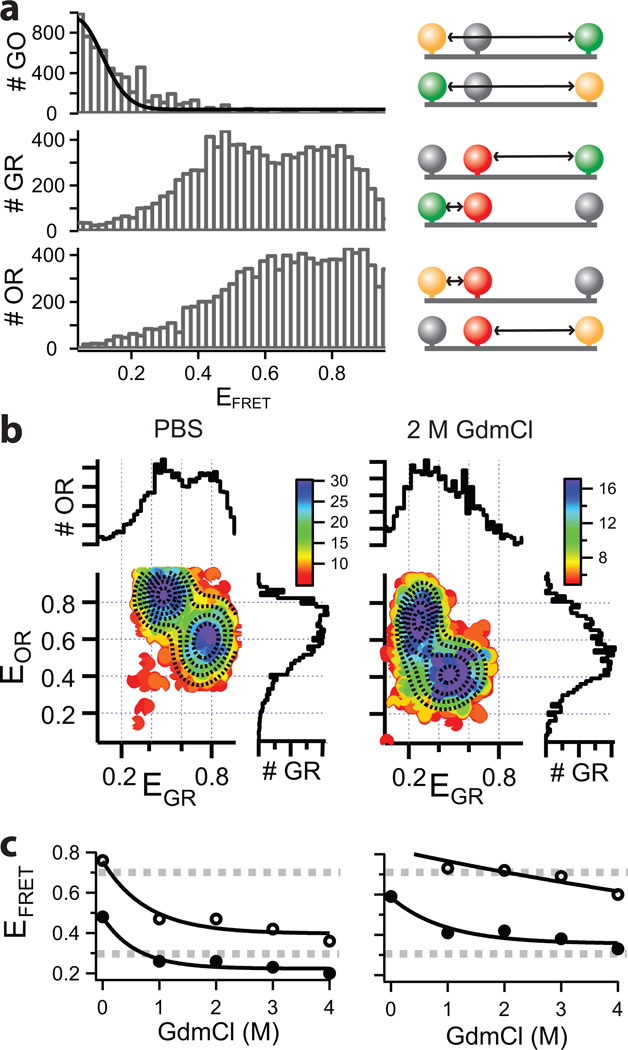
Figure 1.
a) One dimensional FRET histograms of for the three dye combinations (EGO, EGR, EOR, left panel) are shown together with the corresponding labeling schemes (right panel). b) Shown is the 2D data of EOR vs. EGR for PBS and 4M GdmCl (left and right panel respectively) with their projections along both axes. The dashed lines are the result of a multivariate 2D Gaussian fit clearly identifying two species, one centered at (EOR, EGR)=(0.84,0.48) and one at (EOR, EGR)=(0.59,0.76) for PBS. Titration with increasing GdmCl decreases EFRET for all populations as summarized in (c). Open circles correspond to the short distance and filled circles to the long distance as indicated in the cartoon (a). Dashed lines indicate boundaries for more sensitive measurements (compare to Figure 1).

