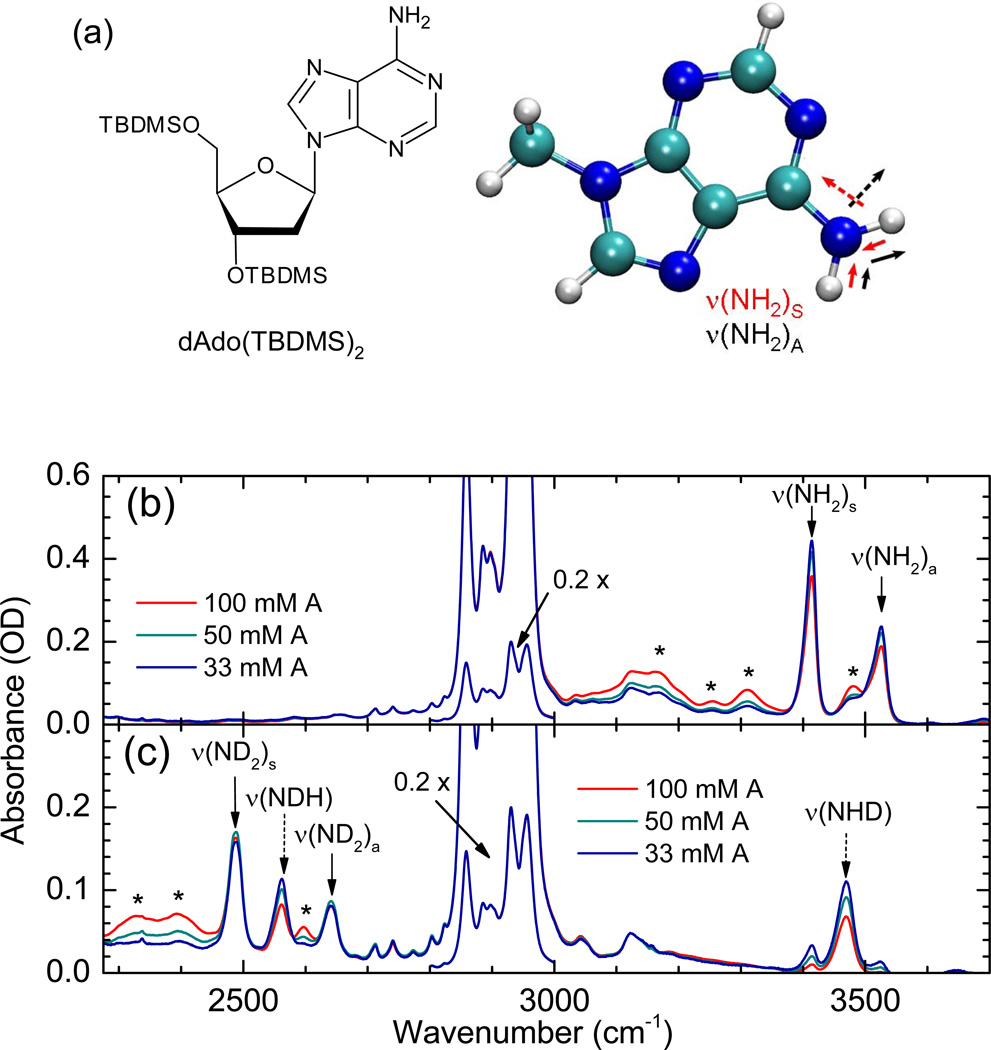
Figure 1.
(a) Molecular structure of A, incl. TBDMS-ribose side group. The symmetric and asymmetric N-H stretching normal modes of 9-mA are also shown. (b) Linear FT-IR spectrum of A in CDCl3. (c) Linear FT-IR spectrum of partially H/D-exchanged A in CDCl3. Relevant N-H and N-D stretching modes are assigned with arrows; asterisks denote bands of A•A complexes; the spectral region between 2800 and 3000 cm−1 showing the C-H stretching modes of the TBDMS-ribose side groups have been scaled by a factor of 0.2.

