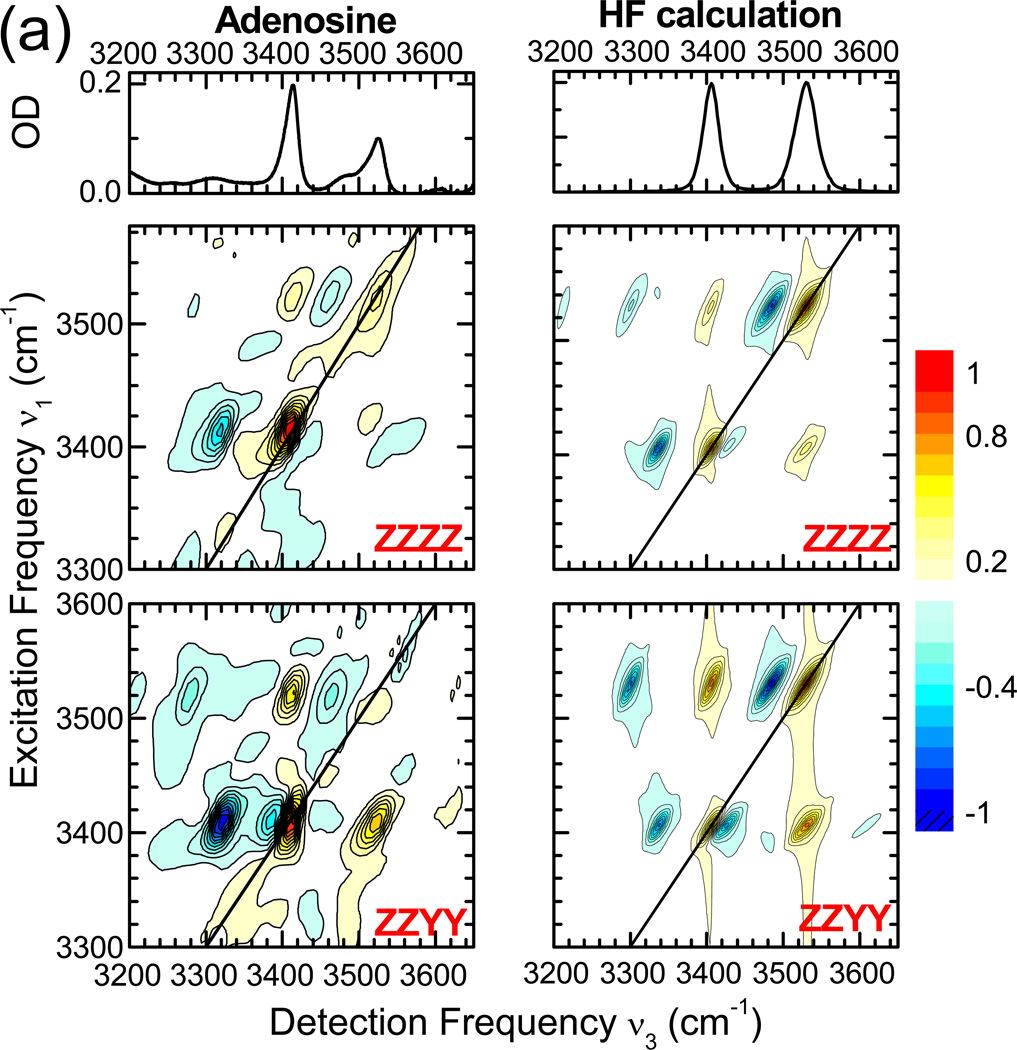
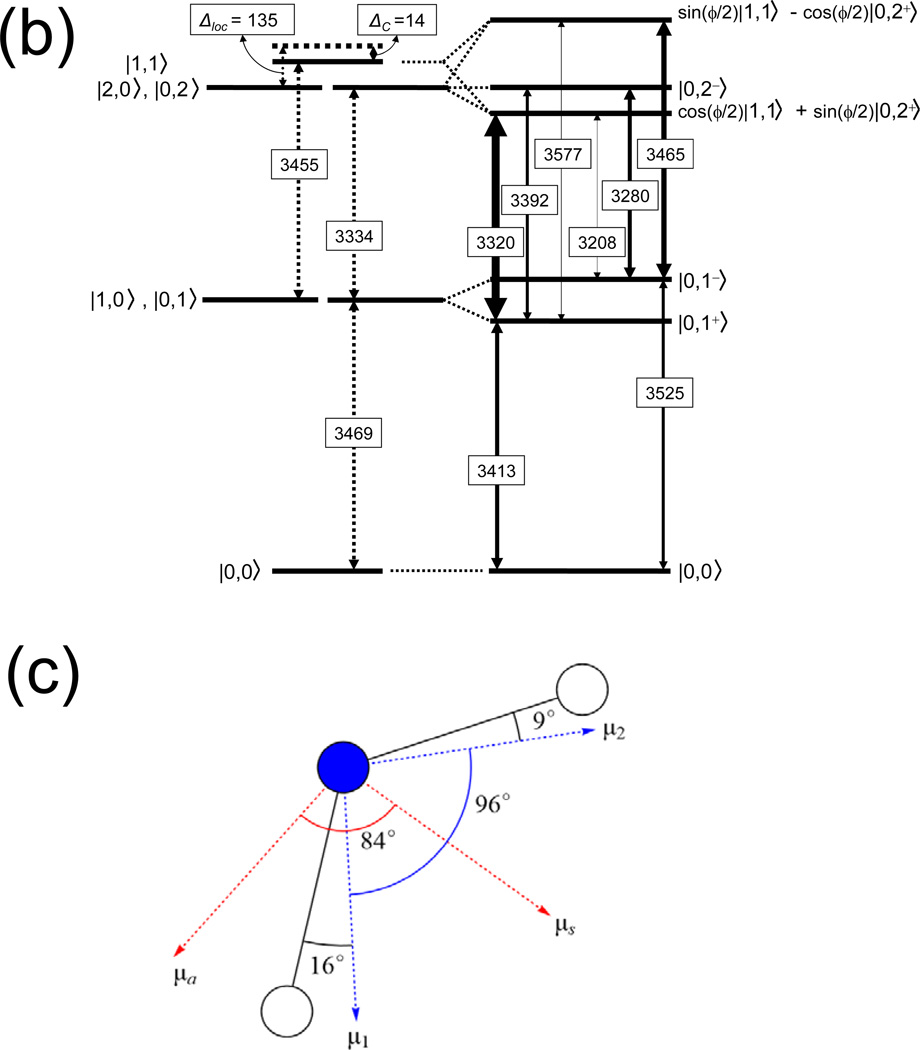
Figure 5.
(a) 2D-IR spectra of adenosine monomer (left column) recorded at a population waiting time of 200 fs, using the (ZZZZ) and (ZZYY) polarisation conditions (second and third row, respectively). Calculated 2D-IR spectra for A monomer are given in the second column. The linear FT-IR spectra are depicted in the top panels. (b) Level scheme in the local mode representation with the uncoupled levels shown on the left and the coupled levels on the right. The thicknesses of the n=0 → n=1 and n=1 → n=2 transitions are scaled to the intensities in the 2D-IR spectra calculated with the coupled local mode model. (c) Orientational information on bond vectors and dipole moments.


