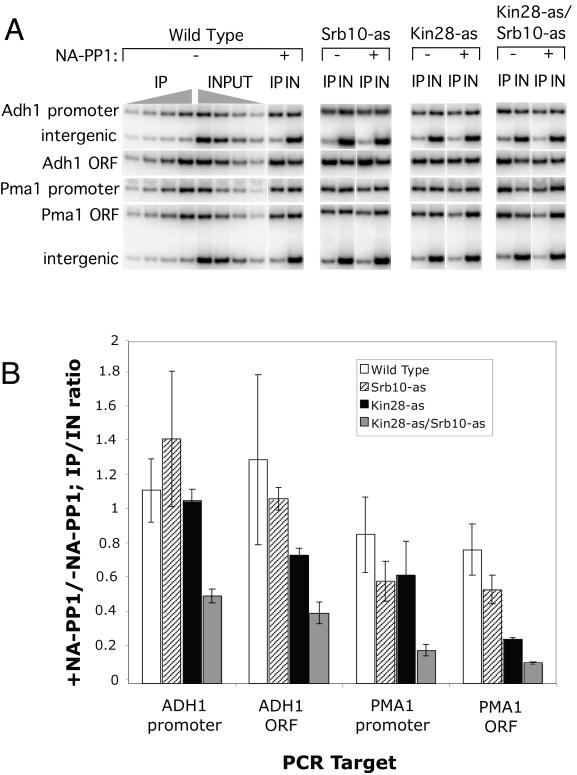
FIG. 4.
Inhibition of Kin28 and Srb10 in vivo. (A) Representative chromatin IP data from one experiment. The indicated strains were either treated or not treated with 6 μM NA-PP1 for 12 min and cross-linked with formaldehyde, and sheared DNA was isolated. Pol II cross-linking was assayed by IP with Rpb3 antisera followed by quantitative PCR. For all samples, a series of four different DNA concentrations were used for PCR in the linear range of the assay. Shown are PCR products of representative IN or IP samples. (B) Quantitation of results from two separate chromatin IP experiments. Results are plotted as the ratio of signals seen with and without NA-PP1 treatment.

