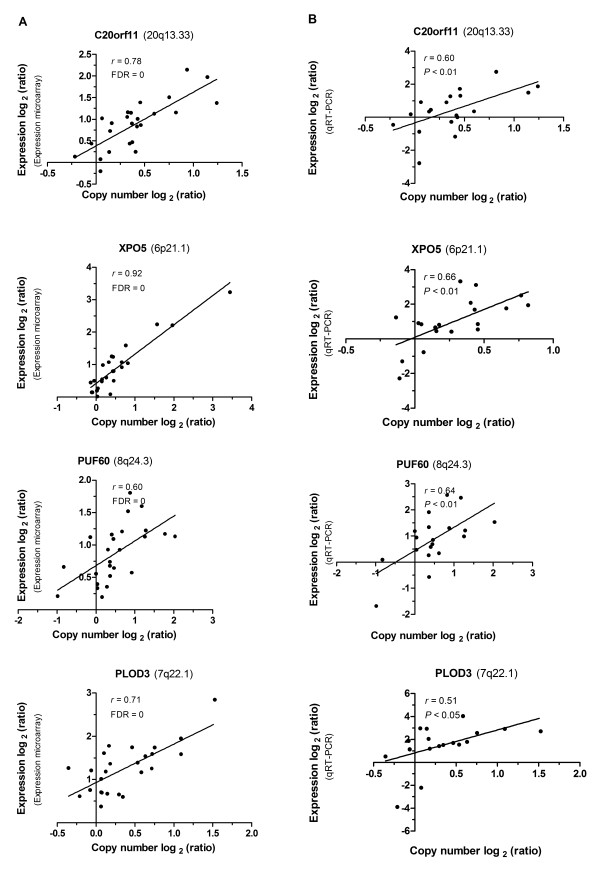
Figure 4.
Correlation between copy number ratios and expression ratios in representative genes was validated by qRT-PCR. Each dot indicates an individual sample. The X axis displays copy number log ratios and the Y axis shows gene expression log ratios from microarray (A) or qRT-PCR (B). FDR, false discovery rate.

