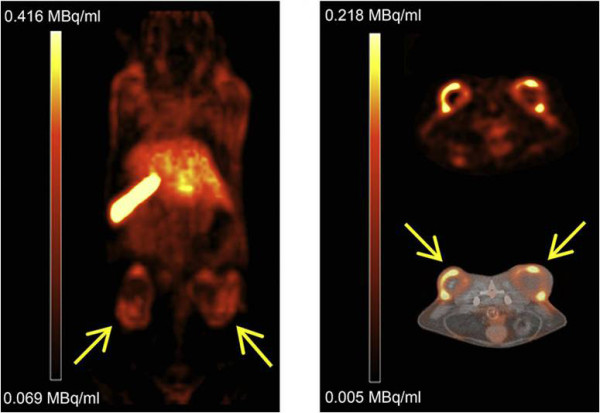
Figure 5.

PET/CT images of 64Cu liposome distribution in HT29 tumor-bearing mice. Tumors were implanted on the right and left flanks. Coronal PET image 24 h after injection (left). Axial PET image (right top) and axial PET/CT fusion (right bottom) images 24 h after injection. Adapted with permission from [50].
