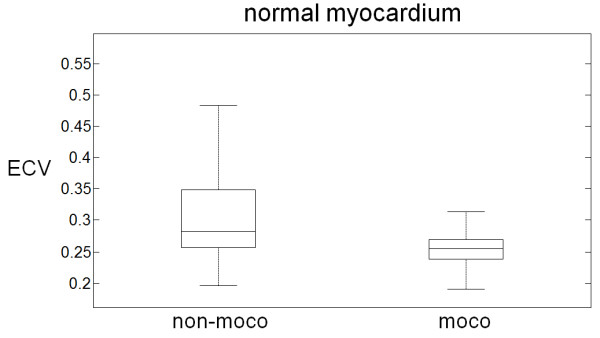
Figure 8.

Measured ECV values (n = 62 subjects) for normal myocardium measured in the mid-wall of the myocardium with and without motion correction and co-registration showing that motion correction significantly reduces variability (p < 0.001). Box and whisker plots show median, 25 and 75 percentiles, and range.
