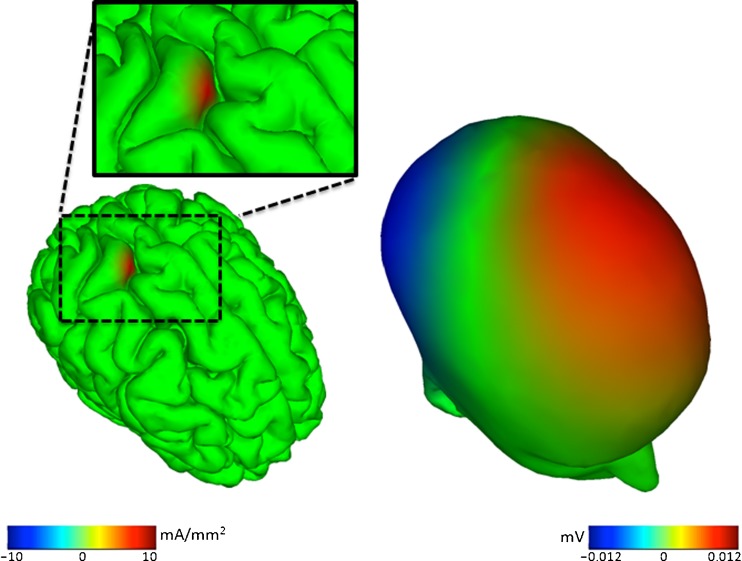
Fig. 1.
Propagation of cortical electroencephalography (EEG) source potentials to scalp electrodes. A simulated (roughly cm2) cortical EEG source region (left) is shown, and its broad potentials projected to the scalp by volume conduction (right). For example, the source of the positive (red) scalp potential on the left frontal scalp is not a frontal brain source. Similar animations further illustrating the complexity of spatial relationships between brain source activities and scalp EEG activities are available at: http://www.youtube.com/playlist?list=PLDF9D201769ADC62D. (Image credit: Zeynep Akalin Acar [83])

