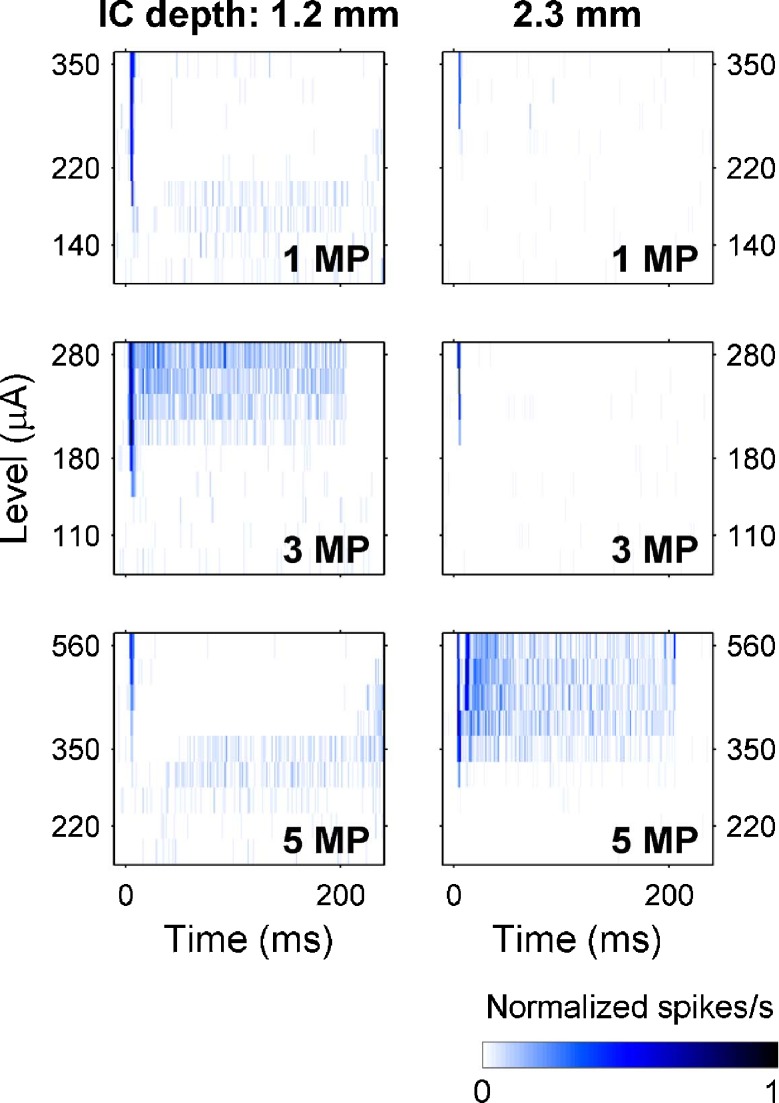
FIG. 11.
Post-stimulus time histograms for the unit responses from Figure 10 at various stimulus levels. In each image, the rows represent PSTHs at different stimulus levels with response strengths indicated by color. For the 1.2-mm deep recording site, at higher levels 3 MP produced sustained responses whereas 1 and 5 MP inhibited spontaneous activity (after a brief onset response). In contrast, for the 2.3-mm site 5 MP produced sustained responses, but 1 and 3 MP produced only onset responses.

