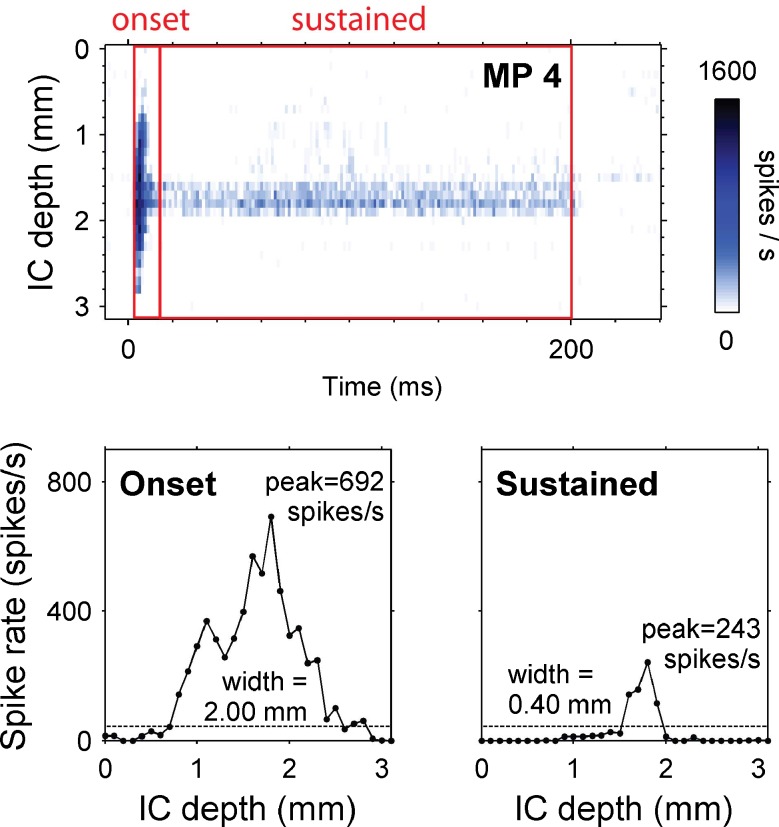
FIG. 4.
Activation width and peak spike rate calculations. Top panel: temporal response profile for a 200-ms pulse train on monopolar channel 4 in a cat (level = 500 μA, 6 dB SL, stimulus begins at 0 ms). Onset and sustained time windows are 4–14 and 14–200 ms, respectively. Bottom panels spike rate versus IC depth averaged over the onset time window (left) and sustained time window (right). Each data point shows the spike rate from one IC recording site. Activation width is calculated by counting the number of recording sites with spike rates above the spike rate criterion (dotted line five times the mean spontaneous rate averaged across all recording sites) and multiplying this count by the recording site spacing (50 μm in guinea pigs and 100 μm in cats).

