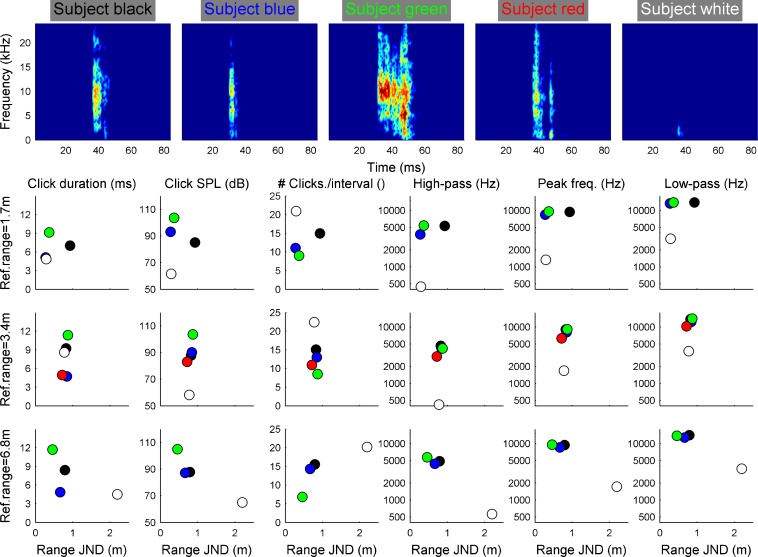
Fig. 3.
Acoustic analysis of the tongue clicks emitted by the subjects to solve the psychophysical task in relation to their performance. The upper row shows spectrograms of exemplary tongue clicks by the subjects in the experiment. The sound level is color-coded; the color axis spans 80 dB. The lower columns represent different tongue click parameters as depicted in the column title. Individual averages are shown using the same colors as in Fig. 2. Overall, the analysis shows that within a single interval subjects produced between 5 and 22 short (4–12 ms) tongue clicks. Apart from one subject (white) tongue clicks were typically loud (85–108 dB SPL) and high frequency (peak frequencies around 6 to 9 kHz).

