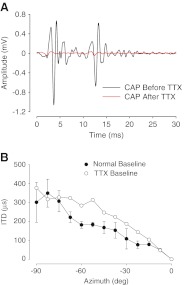
FIG. 10.
Compound action potential responses pre- and post-TTX administration to the round window membrane. Post-TTX measurements were taken ~3 h after TTX administration. A CAP amplitudes after TTX administration (red line) are significantly reduced compared to CAP amplitudes before TTX administration (black line). B Normal baseline (closed circles) and TTX-treated baseline (open circles) ITD measurements as a function of azimuth (−90 ° = left side) for a 500-Hz stimulus. Data are only shown for one hemisphere in the azimuthal plane.

