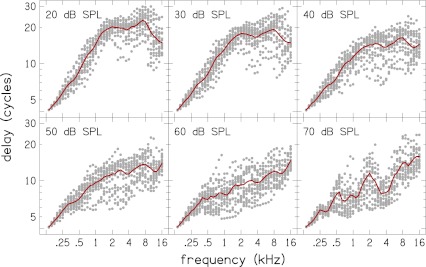
FIG. 12.
N CR versus frequency at different stimulus levels. The group delay N CR at each center frequency for all the subjects (dots) are plotted together for a given stimulus level, together with Loess trend lines to guide the eye. A breakpoint frequency f a|b can be determined by inspection of the Loess trend lines.

