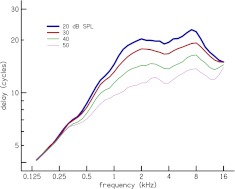
FIG. 13.
Latency–frequency relation at stimulus levels of 20–50 dB SPL. The Loess trend lines for the latency functions N CR at different stimuli levels are plotted together. Above the breakpoint frequency, f a|b = 1.5 kHz, N CR has a near zero slope. The slopes of N CR below and above f a|b are presented in Table 3. CR delay is longer at low levels, compared to high levels. The latency estimates merge below 0.4 kHz, where there is uncertainty about the estimates.

