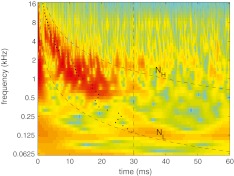
FIG. 2.
Time–frequency analysis of CR using the gammatone spectrogram. The region of high energy of the gammatone spectrogram enclosed by functions N L and N H includes most of the exponential decaying energy of CR. The region below N L includes residual middle ear and measurement system activity that was not removed by the subtraction procedure. The activity beyond t = 30 (indicated with vertical dashed line) is due to re-reflection of the traveling wave. The dots are estimates of the group delay.

