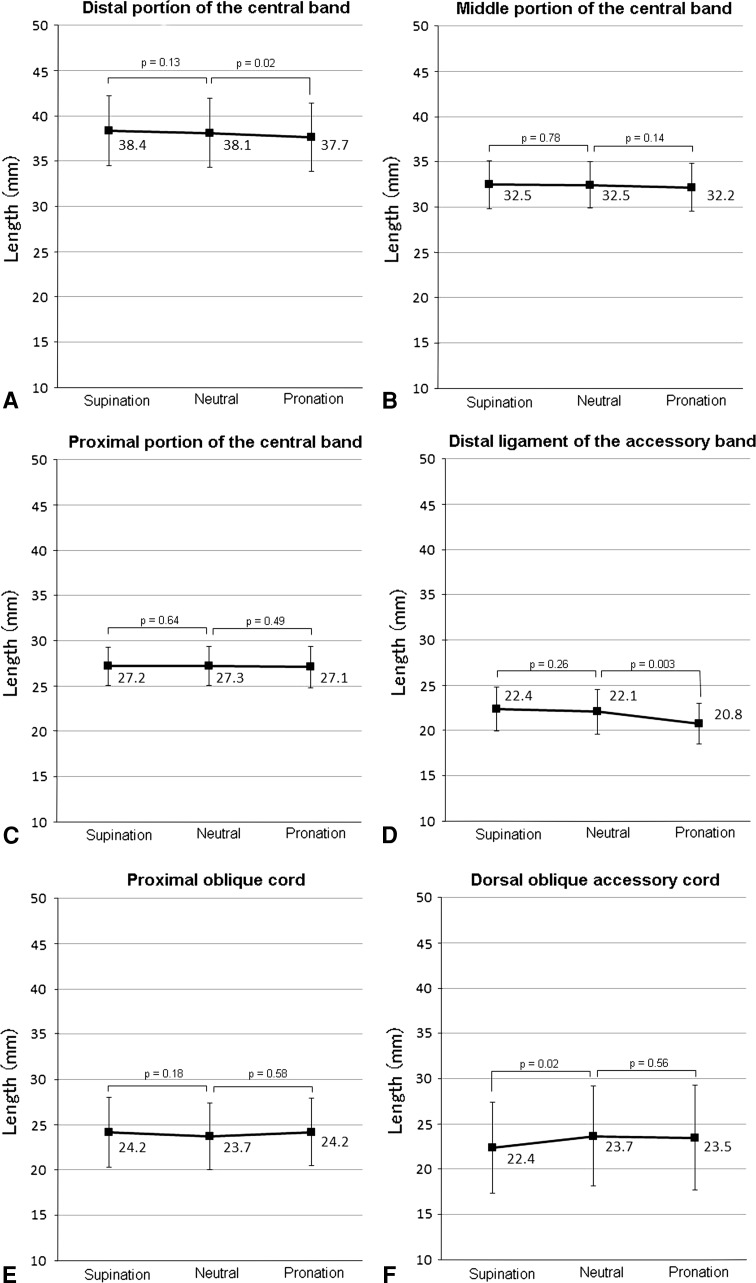
Fig. 4A–F.
The graphs show length change in six interosseous membrane ligaments in a Type 1 lesion: (A) distal, (B) middle, and (C) proximal portions of the central band; (D) distal ligament of the accessory band; (E) proximal oblique cord; and (F) dorsal oblique accessory cord. The middle portion of the central band, proximal portion of the central band, and proximal oblique cord showed little change in length. The length of the distal portion of the central band and distal ligament of the accessory band decreased under pronation and that of the dorsal oblique accessory cord decreased under supination.

