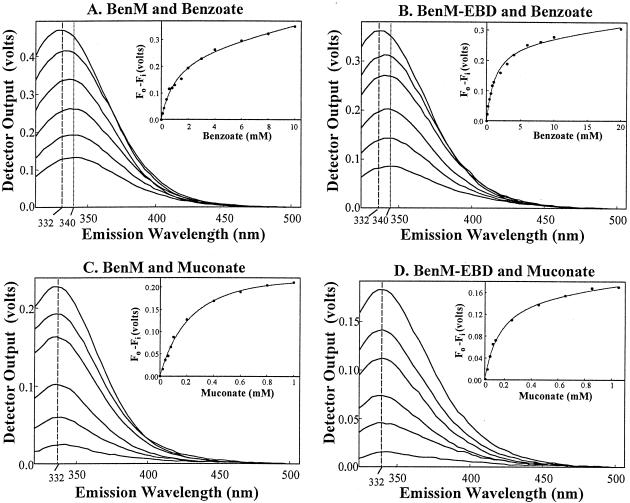
FIG. 2.
Fluorescence emission spectra of BenM and BenM-EBD. Emission intensities were assessed by using voltage measurements from the spectrofluorimeter (y axes). Vertical lines indicate the wavelengths corresponding to the maximum intensities of the spectra. From the top to the bottom of panels A and B, the spectra correspond to protein samples with 0, 0.2, 0.6, 2, 4, and 8 mM benzoate with an excitation wavelength of 280 nm. From the top to the bottom of panels C and D, the spectra correspond to protein samples with 0, 0.04, 0.08, 0.2, 0.4, and 0.8 mM muconate with an excitation wavelength of 295 nm. Each spectrum was compiled from the average values of at least three separate experiments. The standard deviations of the averages were less than 20% of the corresponding values. In the insets, the change in spectrum intensity, measured at 340 nm (panels A and B) or at 332 nm (panels C and D), was plotted versus the amount of effector. This change was determined as the initial fluorescence (Fo) minus the fluorescence at concentration i of the effector (Fi). In these plots, the curves were fitted to a hyperbolic binding isotherm (Table 1).

