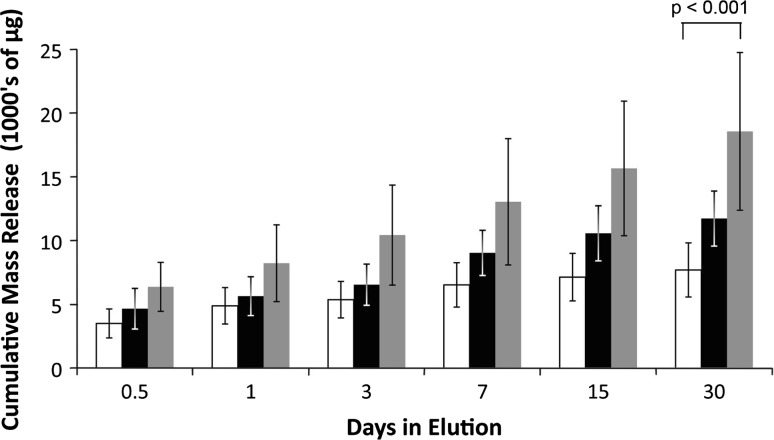
Fig. 3.
The graph shows the cumulative elution of high-dose cement formulated with 10 g of vancomycin. Error bars show standard deviation. White bars indicate the elution from the hand-stirred ALBC. Black bars indicate the elution from the bowl-mixed ALBC. Grey bars indicate the elution of the dough-phase mixed ALBC. Dough-phase mixed ALBC delivered more vancomycin than the other two mixing methods.

