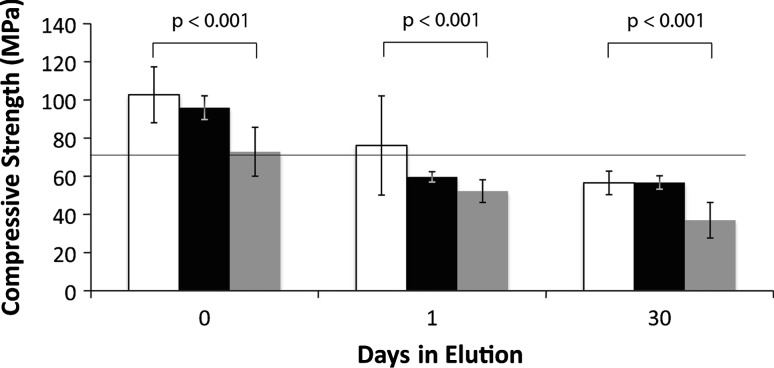
Fig. 4.
The graph shows compressive strength for high-dose ALBC formulated with 10 g of vancomycin per batch of Simplex® P cement. White bars indicate the strength of the hand-stirred ALBC. Black bars indicate the strength of the bowl-mixed ALBC. Grey bars indicate the strength of the doughphase mixed ALBC. Dough phase mixing produced ALBC that was weaker than the other two mixing methods. Compressive strength decreased over time in elution for all three mixing methods. Error bars indicate standard deviation.

