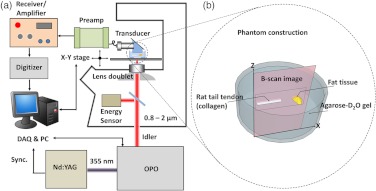
Fig. 1.
(a) Schematic drawing of the setup for multispectral photoacoustic imaging. The multispectral B-scan images were obtained automatically by sequentially tuning the OPO crystal after acquiring a B-scan image. (b) Schematic of the phantom construction. The white stripe-shape indicates rat tail tendon, and the yellow bulk indicates the fat tissue.

