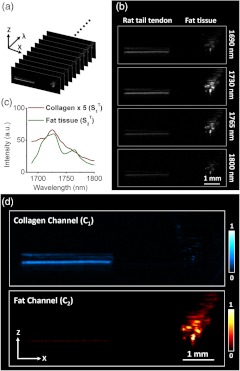
Fig. 3.
Multispectral photoacoustic images of the tissue phantom composed of tendon and fat with augmented MCR-ALS analysis: (a) multispectral photoacoustic images of phantom of tendon and fat; (b) selected photoacoustic images of phantom of tendon and fat at wavelengths of 1690, 1730, 1765, and 1800 nm; (c) spectral profiles recovered from augmented MCR-ALS analysis; (d) distribution maps of collagen and lipid yielded by MCR-ALS analysis of the multispectral photoacoustic image. : distribution map of chemical component corresponding to the collagen spectral profile, . : distribution map of chemical component corresponding to the fat spectral profile, .

