
Fig 4.
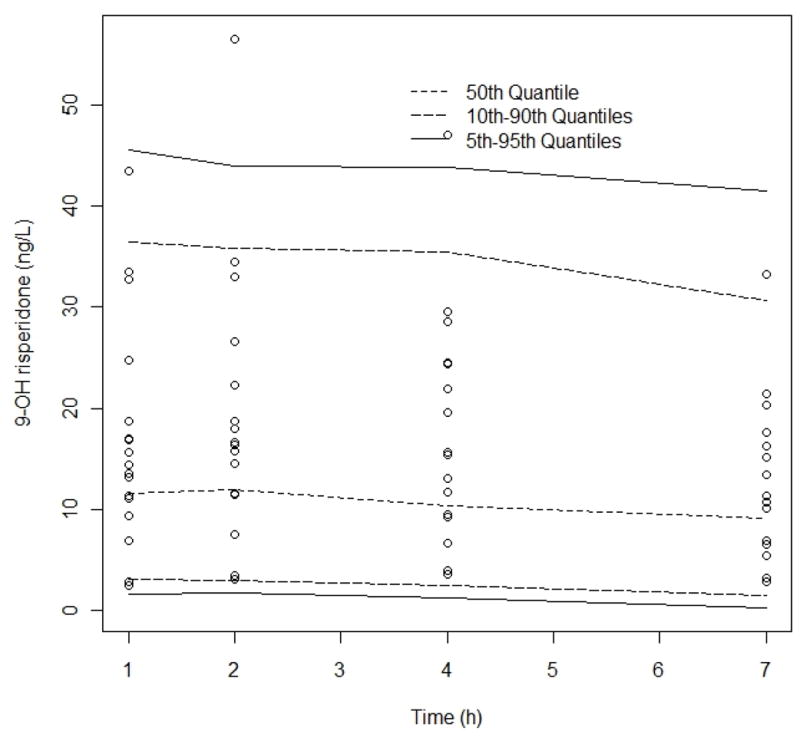
Visual Predictive Check, 9-OH risperidone observed data compared to the 95th, 50th, and 5th percentiles for 100 simulated data sets. No of simulated observations = 3794, % observations outside 90% CI = 3%. Observed data binned according to “ideal” sampling times after dose 1, 2, 4 and 7 h. Comparison of median (dashed line) and 5–95th percentile interval (solid black lines)