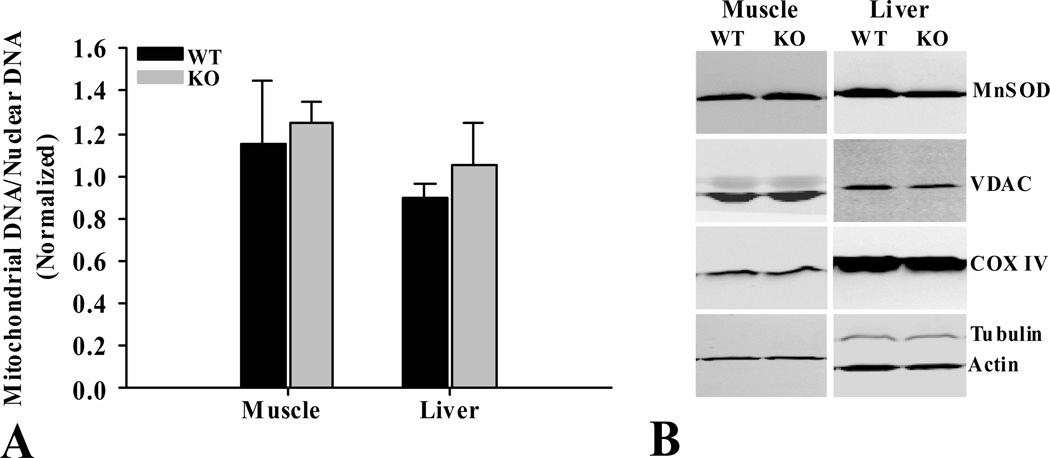
Figure 8.
Mitochondrial content of skeletal muscle and liver from ShcKO (KO) and wild-type (WT) mice. (A) Mitochondrial and nuclear DNA were determined and the ratio calculated as described in the text. (B) Levels of key mitochondrial proteins (Mn-SOD, VDAC, COX IV) were also determined by western blotting, as described in the text. These two measures were taken as indicators of mitochondrial content of tissues investigated. No differences were observed between KO and WT mice for the tissues investigated. Data are mean ± SEM; n = 6 per group.

