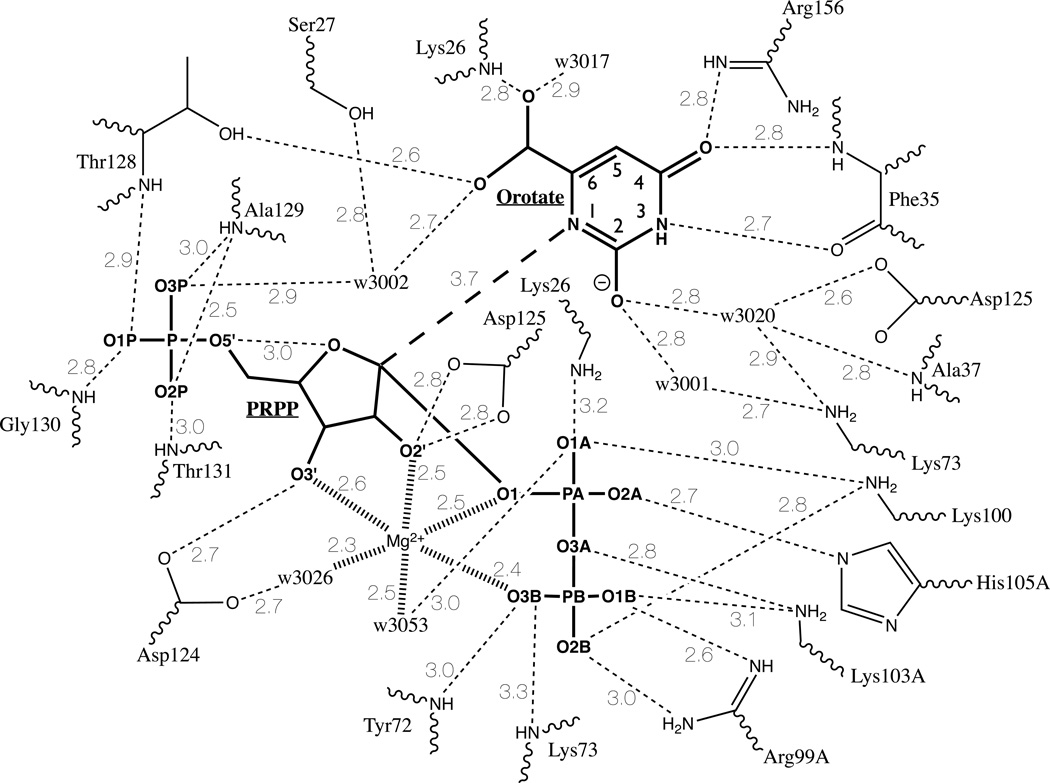
Figure 5.
Cartoon of binding interactions in the active site of Subunit B. Substrate covalent bonds are shown in bold. Hydrogen bonds (< 3.5 Å) are shown as dashed lines. Bold dashed line indicates N1 (orotate) to C1 (PRPP) reaction coordinate. Mg2+ coordination bonds are shown as hashed lines. Solvent water molecules are indicated by “w” with the four digits of the pdb designation shown. Note that residues Lys26. Lys73, and Asp125 are each shown twice in the diagram.

