Figure 5.
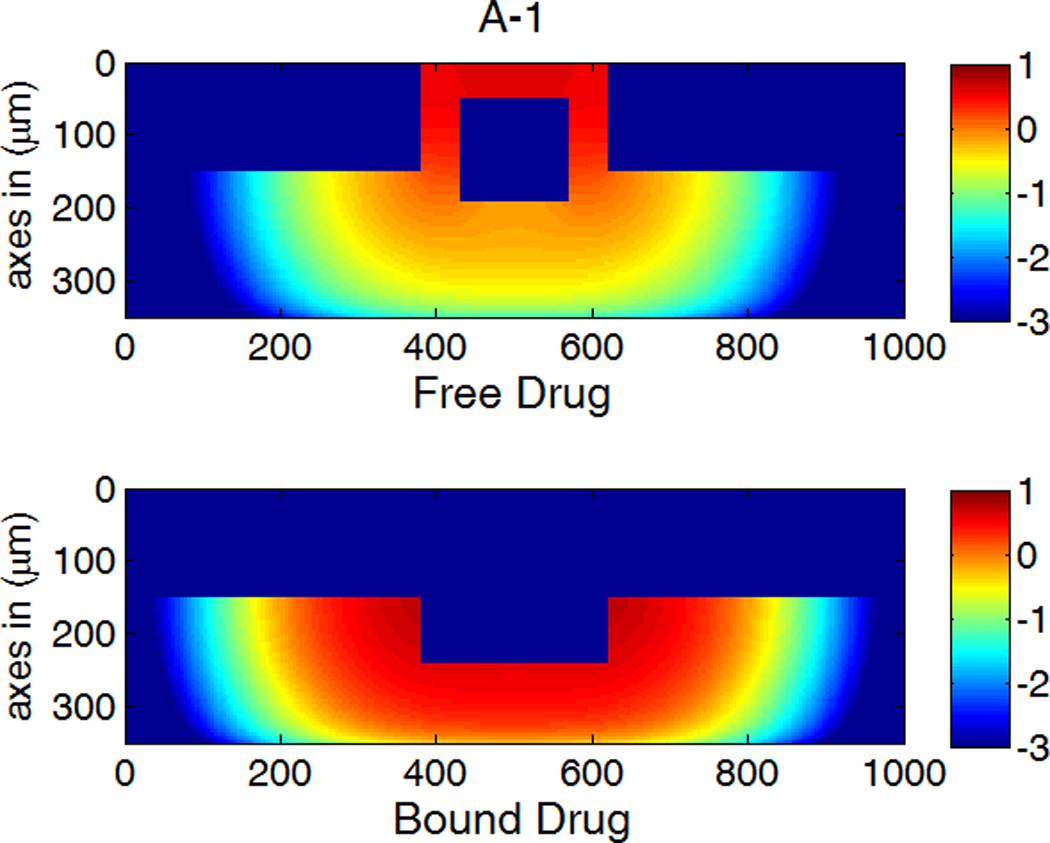
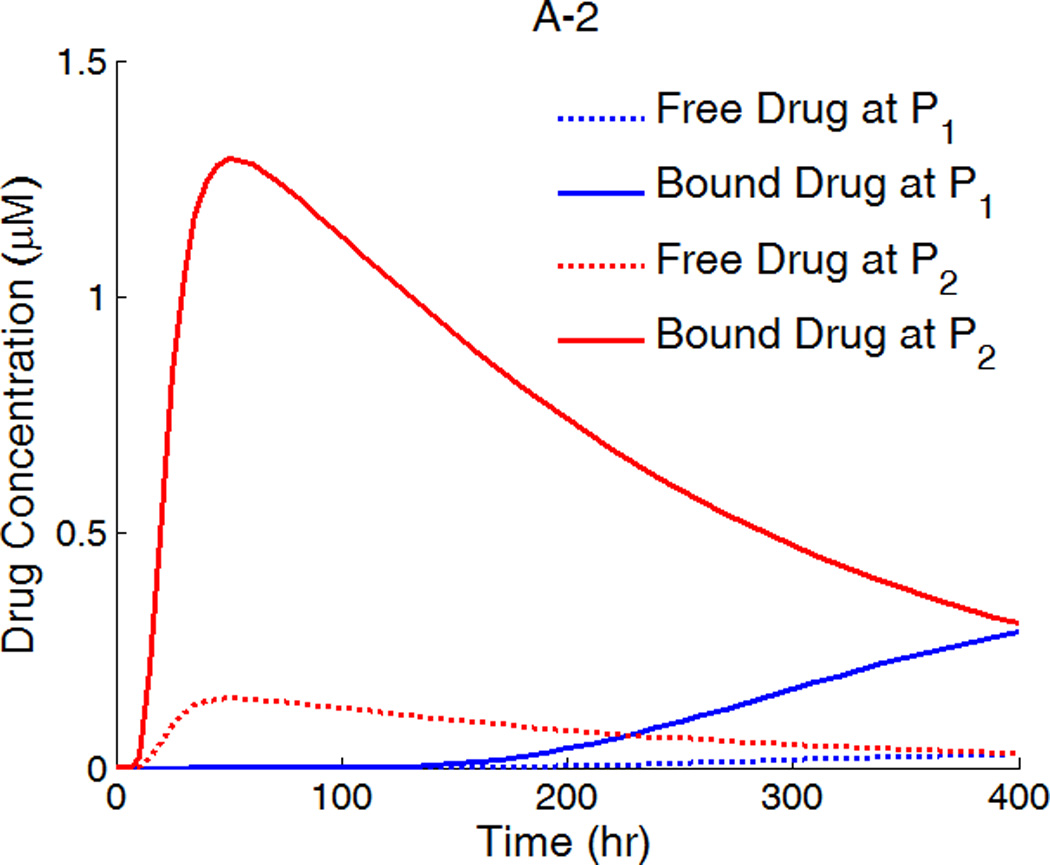
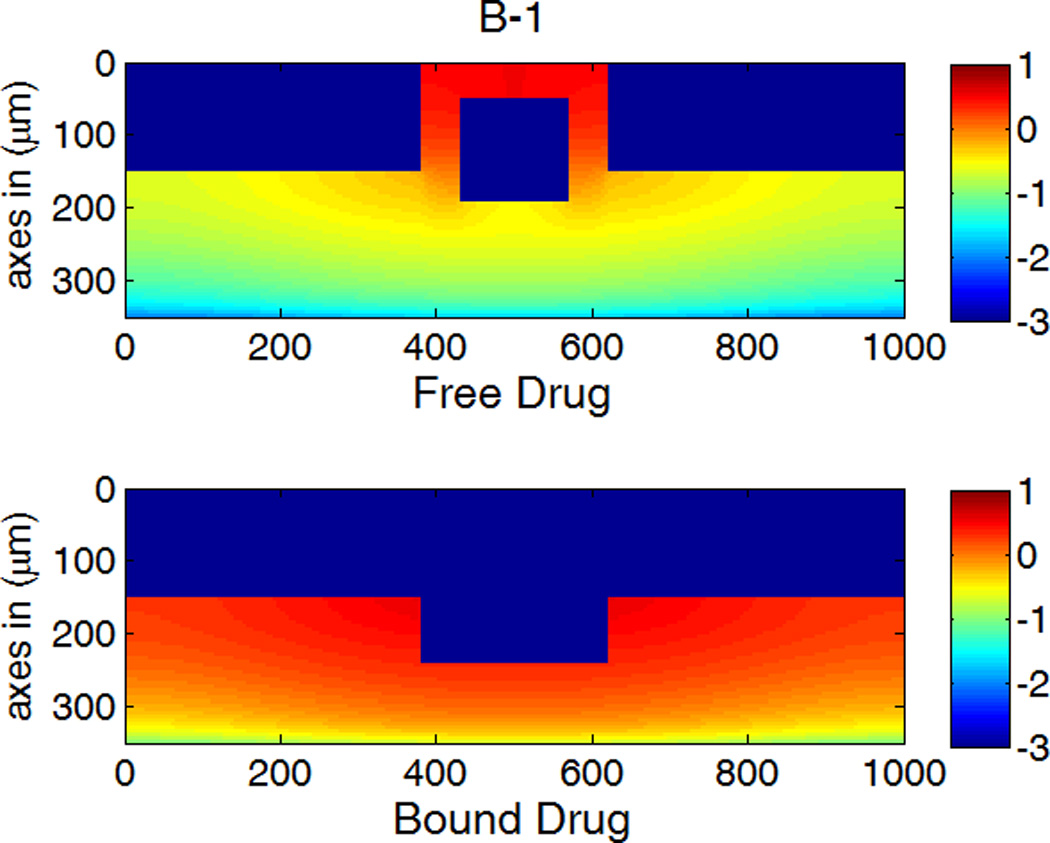
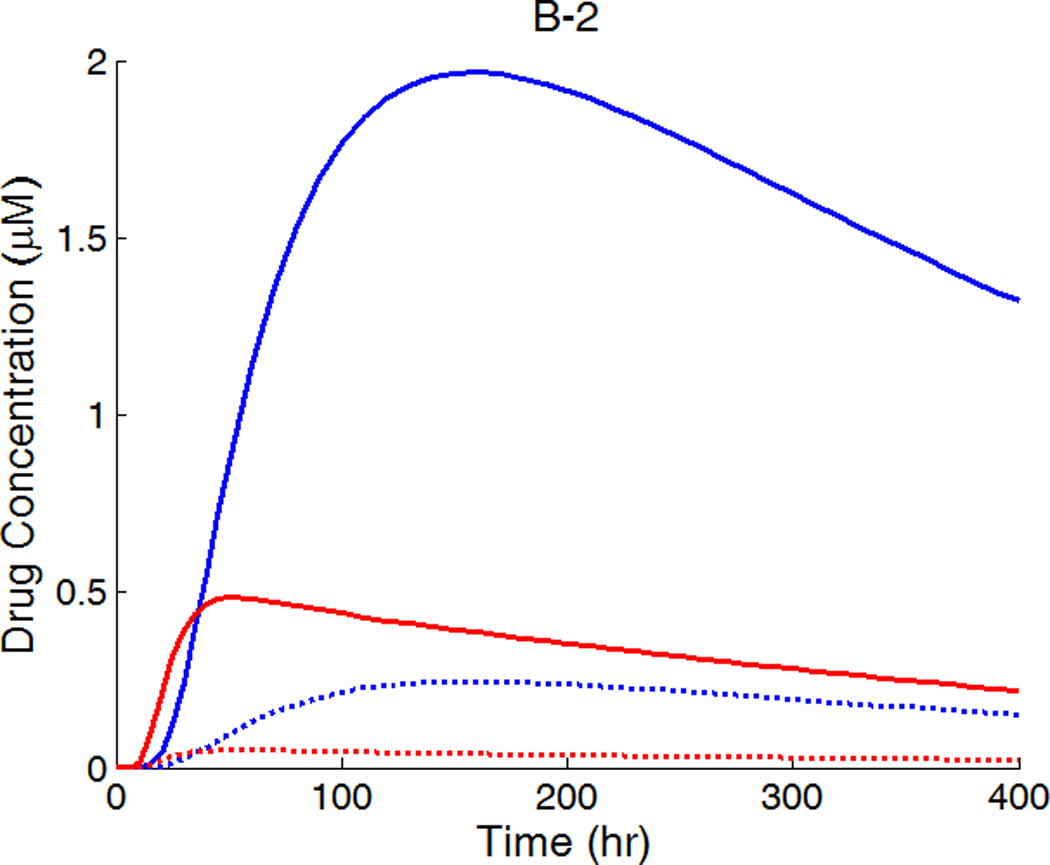
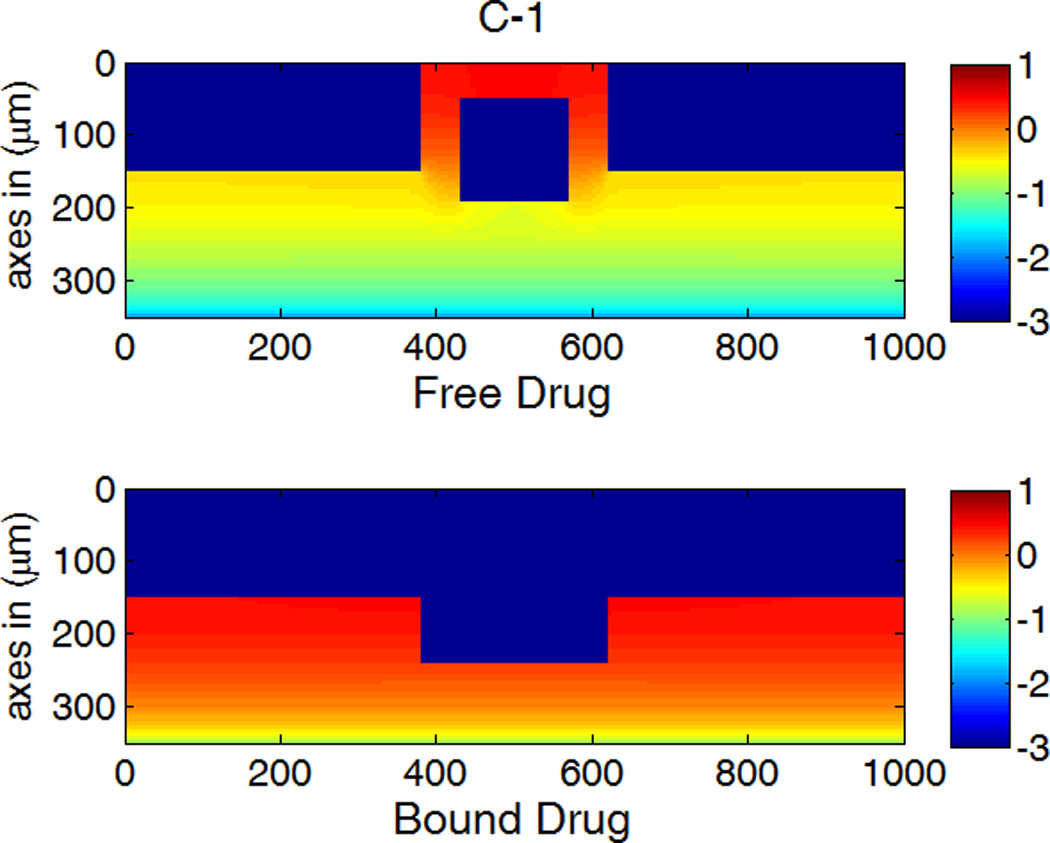
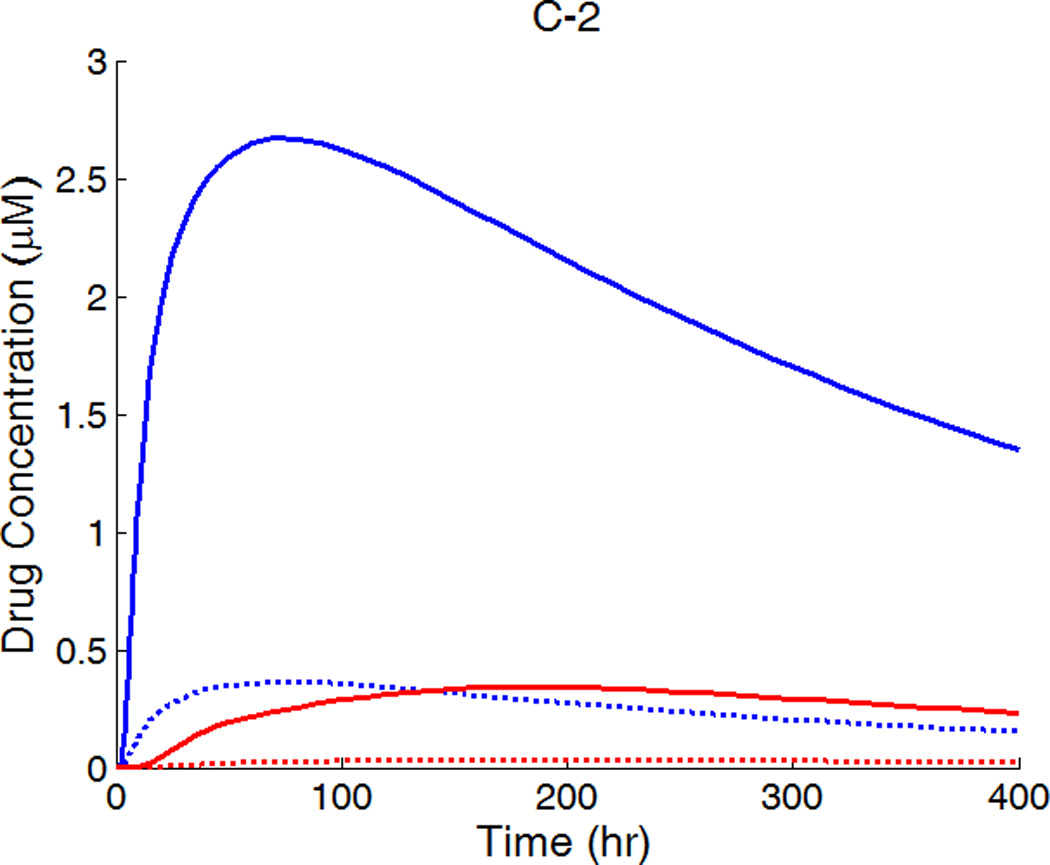
A,B,C-1: drug concentration fields at different circumferential diffusivities at 100 hr with low drug loading in the coating (logarithmic plots, D2x = 0.1 µm2/s, x and y axis are dimensions in µm); A,B,C-2: time evolution of drug concentrations (µM) at point P1 (blue) and point P2 (red), free (--) and bound (—) drug. (A) D2y = D2x, (B) D2y = 10D2x, (C) D2y = 100D2x.
