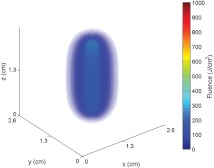
Fig. 6.
3D rendering of the simulated fluence distribution around an optical fiber with the proximal end of a 2-cm-long diffusing segment of the fiber positioned at above the boundary separating the tumor and normal tissue regions. Tumor optical properties were set to , , and , which correspond to values extracted from an urothelial carcinoma at 630 nm, as shown in Fig. 5(c) and 5(d). Voxel size was .

