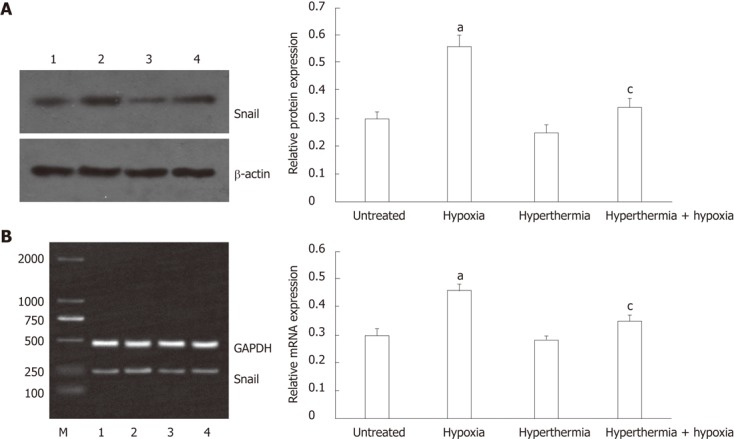
Figure 4.

Western blot and reverse transcription-polymerase chain reaction analysis of Snail expression in HepG2 cells. A: Western blot: Lanes 1, 2, 3 and 4 represent untreated cells, hypoxia-treated cells, hyperthermia-treated cells and hyperthermia + hypoxia-treated cells, respectively. The bar graphs show the relative expression levels of Snail after normalization to β-actin; B: Reverse transcription-polymerase chain reaction: The representation of the lanes was the same as in (A); the bar graphs show the relative expression levels of Snail normalized to glyceraldehyde-3-phosphate dehydrogenase (GAPDH). aP < 0.05 vs untreated cells; cP < 0.05 vs hypoxia-treated cells.
