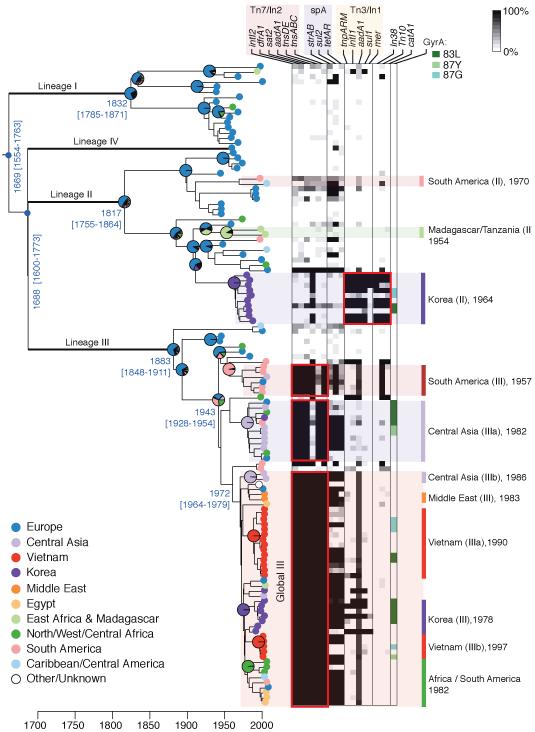
Figure 1. Bayesian maximum clade credibility phylogeny for S. sonnei.
Branches defining major lineages in bold (each had 100% posterior support); pie charts indicate ML estimates for geographic origin of major nodes, according to inset legend (lower left). Time (x-axis) is relative to the Common Era; divergence dates (median estimate and 95% HPD) are given in blue for major nodes. Distribution of antimicrobial resistance determinants is indicated in the heatmap according to the legends provided, which reflect percentage of bases in each gene sequence that are covered by reads from each isolate (top right). Geographically localised clonal expansions are highlighted on the right, labeled with their median estimated divergence date.

