Figure 5.
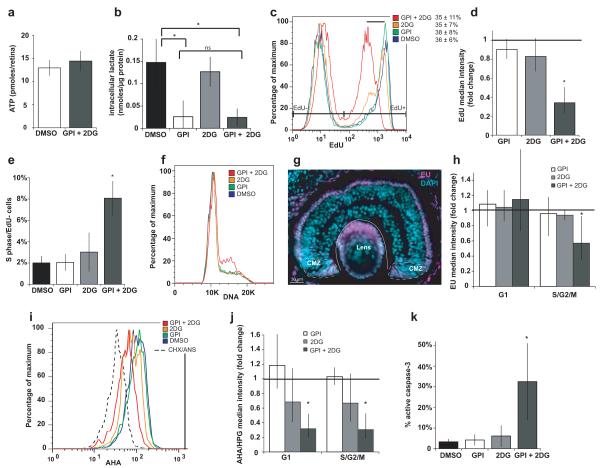
Complete glycolytic block inhibits progenitor proliferation, biosynthesis and survival. (a) ATP in explants in MBS does not change after 30 minutes of GPI+2DG (n=20). (b) Intracellular lactate after 3 hours of GPI and/or 2DG (data from the same set of experiments as Fig. 3c and Supplementary Fig. 1f; GPI + 2DG, n=6, p=0.003 compared to control, p>0.05 compared to GPI). (c-f) GPI+2DG but not either drug alone, for 8-10 hours in MBS in explants: (c-d) reduces EdU incorporation per cell after a short pulse (n=4, p=0.006) (black bar indicates shift in histogram) but not % EdU+ cells, (e) increases the proportion of S phase cells which do not incorporate EdU (n=3, p=0.02), (f) causes cells to accumulate in S phase (observed in 10/11 experiments for GPI+2DG; 3/13 for GPI and 1/11 for 2DG). (g) The nucleotide analogue 5-ethynyl-uridine (EU) is incorporated in RNA at much higher levels in CMZ proliferating cells and in photoreceptors compared to other retinal differentiated cells in vivo (stage 41). (h-k) GPI + 2DG but not either drug alone (h) reduces incorporation of EU into RNA in S/G2 (n=4, p=0.03), (i-j) reduces incorporation of the methionine analogues AHA or HPG into proteins in G1 (n=4, p=0.02) and S/G2 (n=4, p=0.02) (dashed histogram is background fluorescence when the protein synthesis inhibitors cycloheximide + anisomycin are used with AHA), and (k) increases the proportion of active-caspase-3+ apoptotic cells (n=5, p=0.03).

