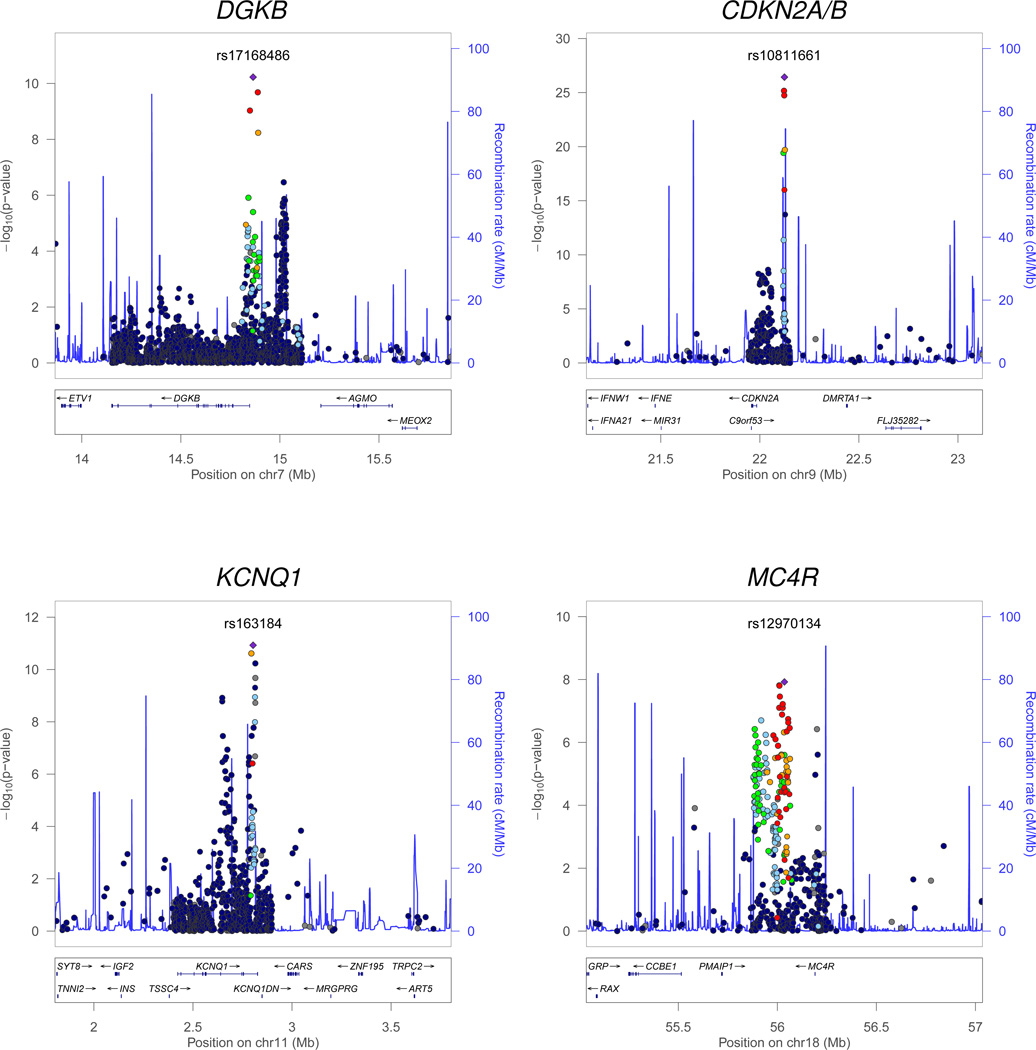
Figure 2.
Regional plots of T2D susceptibility loci with evidence of multiple association signals. Each point represents a Metabochip SNP passing quality control in our combined meta-analysis, plotted with their P-value (on a -log10 scale) as a function of genomic position (NCBI Build 36). In each panel, the lead SNP is represented by the purple diamond. The color coding of all other SNPs (circles) indicates LD with the lead SNP (estimated by CEU r2 from the 1000 Genomes Project June 2010 release): red r2 ≥ 0.8; gold 0.6 ≤ r2 < 0.8; green 0.4 ≤ r2 < 0.6; cyan 0.2 ≤ r2 < 0.4; blue r2 < 0.2; grey r2 unknown. Recombination rates are estimated from the International HapMap Project and gene annotations are taken from the University of California Santa Cruz genome browser.

