Figure 1.
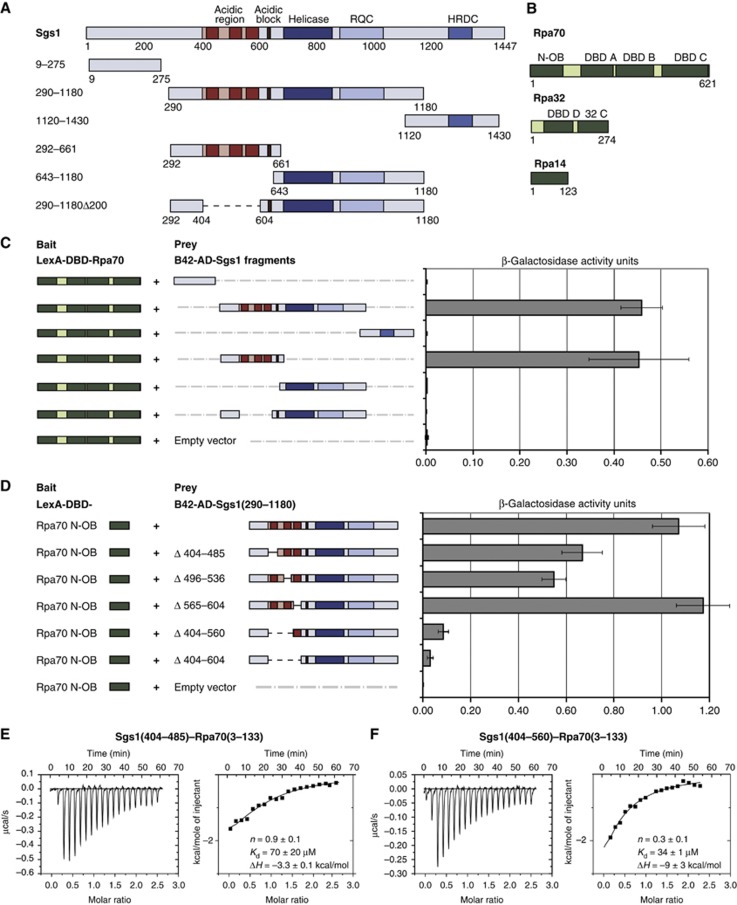
Mapping the interaction site between Sgs1 and Rpa70. (A) Schematic representation of Sgs1 and its functional domains. Dark and light red—largely disordered acidic region, dark red—sequences that are conserved in close homologues of S. cerevisiae; other domains labelled in figure. RQC=RecQ C-terminal motif, HRDC=helicase and RNase D C-terminal. Below are the Sgs1 domains used in Y2H experiments, which were fused to the B42 activation domain (B42-AD) in pJG46 and expressed under a galactose-inducible promoter. Numbers indicate the boundaries of the Sgs1 domains in aa. (B) Scheme of the RPA subunits with their functional domains. Rpa70 and Rpa32 were fused to the lexA-DNA binding domain (lexA-DBD) in pGAL-lexA, expressed under a galactose-inducible promoter and subjected to Y2H analysis. N-OB=N-terminal OB fold, DBD=DNA binding domain, 32 C=Rpa32 C-terminus. (C) Y2H analysis between Rpa70 fused to lexA-DBD and Sgs1 fragments fused to B42-AD was performed using a quantitative β-galactosidase assay as described in Materials and methods. Error bars indicate standard error of four or more independent transformants. (D) Y2H analysis between Rpa70 N-OB fused to lexA-DBD and Sgs1 fragments fused to B42-AD with different deletions of the three conserved regions within the RPA binding site. (E, F) Isothermal titration calorimetry (ITC) experiment of Rpa70(3–133) with Sgs1(aa 404–485) and Sgs1(aa 404–560). The dissociation constant (Kd), stoichiometry (n) and molar enthalpy (ΔH) are indicated within the figure.

