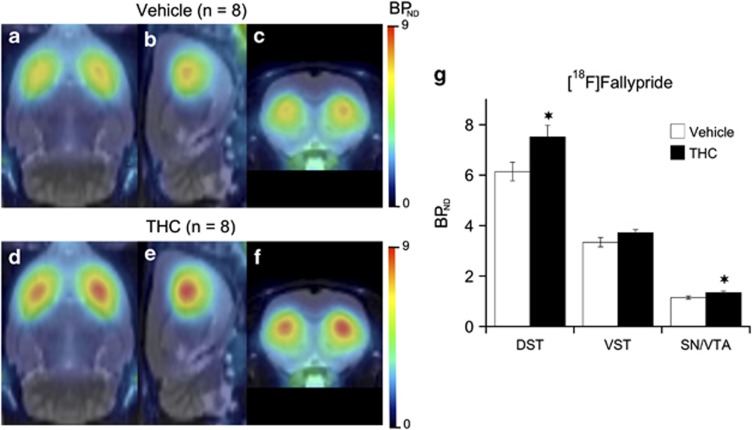
Figure 1.
Mean parametric maps of [18F]Fallypride BPND obtained in groups (n=8) of animals at 24 h following cessation of a 3-weeks treatment with vehicle (a–c) or THC (d–f; 1 mg/kg/day; 21 days). BPND parametric maps are projected upon the MRI rat atlas (gray scale) and are shown in horizontal (a and d), sagittal (b and e), and coronal (c and f) planes at the level of the DST. [18F]Fallypride BPND estimates in vehicle and THC-treated animals are given in g. Data are presented as means±SEM of eight animals per group in the dorsal striatum (DST), ventral striatum (VST), and ventral midbrain, a region including the substantia nigra and ventral tegmental area (SN/VTA). Significantly different from the vehicle-treated group at *p<0.05 using a mixed model repeated-measures ANOVA with a post hoc t-test.

