Figure 6.
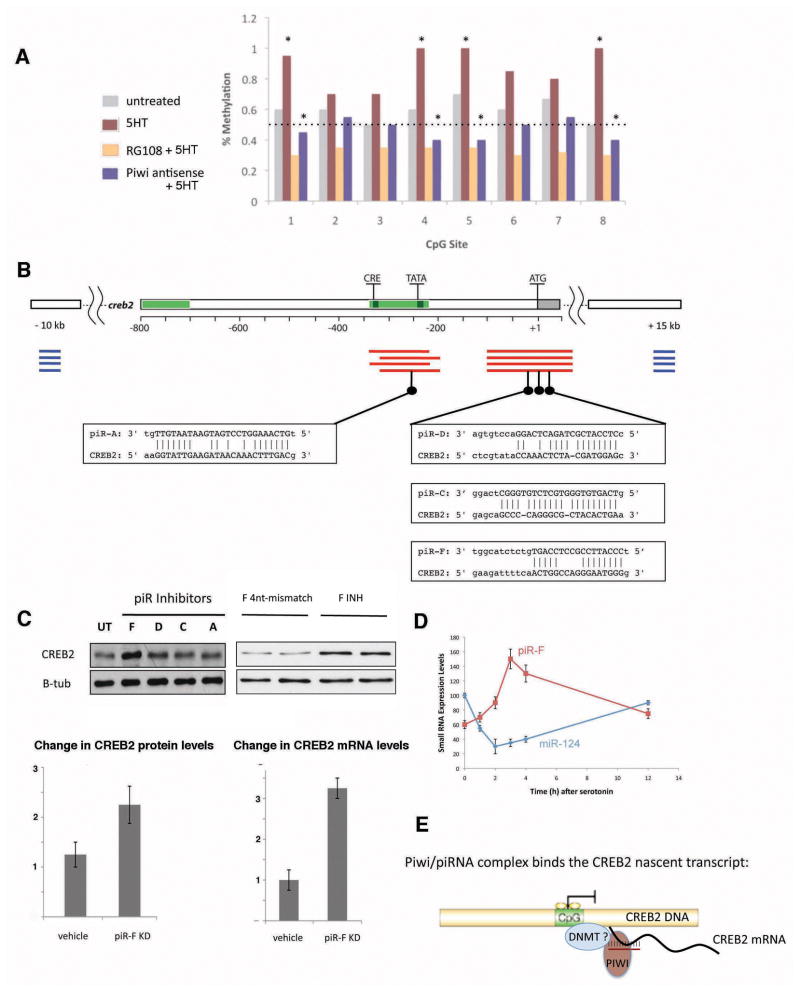
A. Real-time pyrosequencing of the CREB2 promoter region shows increased methylation in response to 5HT (maroon) that is fully reversed when 5HT is applied in the presence of a piwi inhibitor (blue). The results were quantified as a mean of 4 independent trials, and S.D’s were calculated but were so low that they are not shown on the graphs for clarity of the figure.
B. A diagram of the CREB2 genomic locus. The CpG islands are marked in green and the translational ATG start site is indicated. All CpG sites shown in (A) are present within the green bar, indicating the proximal promoter, between the CRE and TATA sites. In red are ESTs mapping to this locus. In blue are piRNA clusters being generated upstream and downstream of the CREB2 locus. piRNAs abundantly generated in trans with potential target sites to transcribed regions (ESTs) from this locus are shown.
C. Inhibition of aca-piR-F caused a significant up-regulation of CREB2 protein and RNA levels when compared to untreated cells, or those treated with inhibitors of aca-piR-A, -C, or –D, or those treated with 4 nucleotide mismatch (F 4nt-mismatch) oligonucleotides antisense to piR-F. Results are quantified and shown as a mean of 3 independent trails ± S.D.
D. The time course of aca-piR-F after the initial exposure to 5HT (time 0 h). The previously described time course of aca-miR-124 is shown for comparison.
E. Because of a putatitive binding site for piR-F at the translation start site of CREB2 and its proximity to the promoter, we speculate that the piwi/piR-F complex may bind the CREB2 nascent transcript and may recruit methylation factors (such as DNMT) to regulate the CREB2 promoter.

