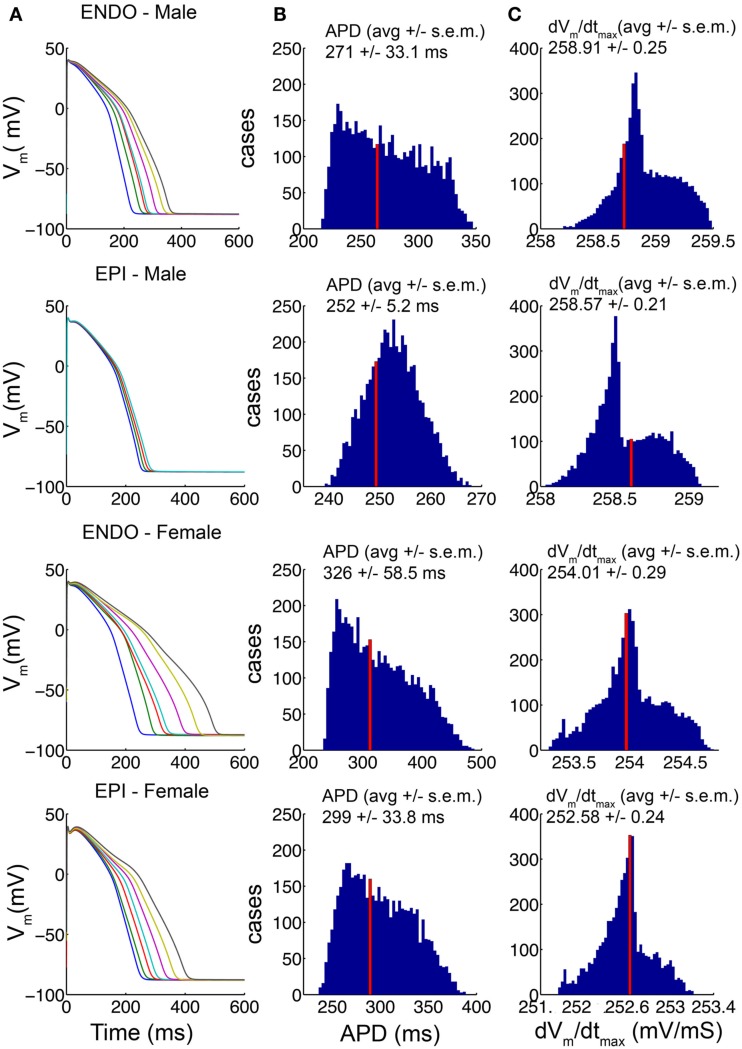
Figure 1.
Channel conductances chosen randomly from within the standard deviation of experimental data (Table S1 the Methods in Supplementary Material) for 5000 simulations of human ventricular cell. The 1000th paced beat at a cycle length of 1000 ms is shown in endocardial and epicardial cell types. Action potentials (APs) from male and female models are shown (A). The distributions of APD variations (B) and the distributions of maximum upstroke velocity (C) for each model are shown. The average values are indicated. The index values derived from the mean experimental values are indicated by the red bars.

