FIGURE 1:
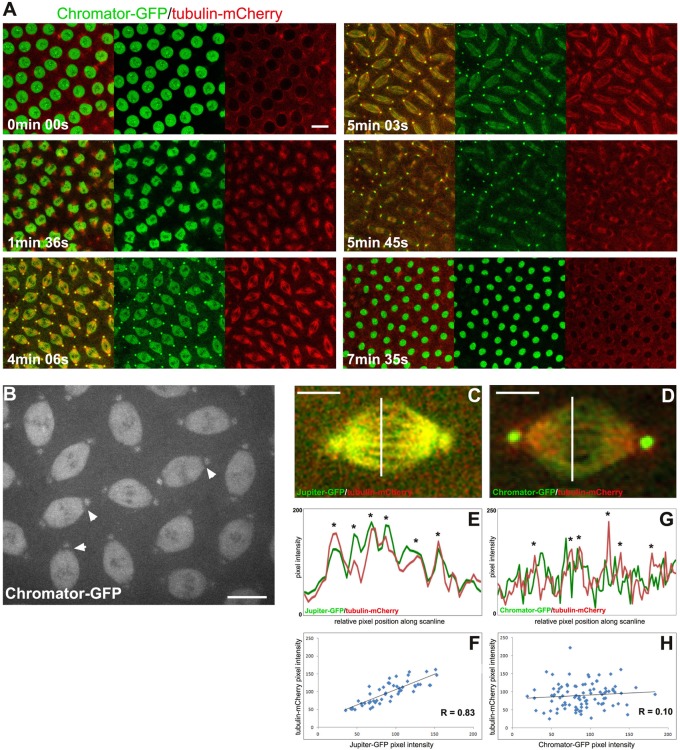
Confocal time-lapse analysis of Chromator-GFP during mitosis in syncytial Drosophila embryos. (A) Relative dynamics of Chromator-GFP (green) and tubulin-mCherry (red) during a complete mitotic cycle. Scale bar, 10 μm. (B) Chromator-GFP at metaphase. Arrowheads indicate the gap between Chromator-GFP's spindle matrix and centrosomal localization. Scale bar, 10 μm. (C) Relative localization of Jupiter-GFP (green) and tubulin-mCherry (red) at metaphase. Scale bar, 5 μm. (D) Relative localization of Chromator-GFP (green) and tubulin-mCherry (red) at metaphase. Scale bar, 5 μm. (E, G) Line-scan plots of pixel intensity across the spindle along the white lines in C and D for Jupiter-GFP/tubulin-mCherry and Chromator-GFP/tubulin-mCherry, respectively. The images in C and D are both from a single confocal optical plane. The asterisks indicate the likely position of microtubule K-fibers. (F, H) Plots of the correlation between pixel intensity between Jupiter-GFP/tubulin-mCherry and Chromator-GFP/tubulin-mCherry across the spindle along the white lines in C and D, respectively. The regression line and the value of Pearson's coefficient are indicated for each plot.

