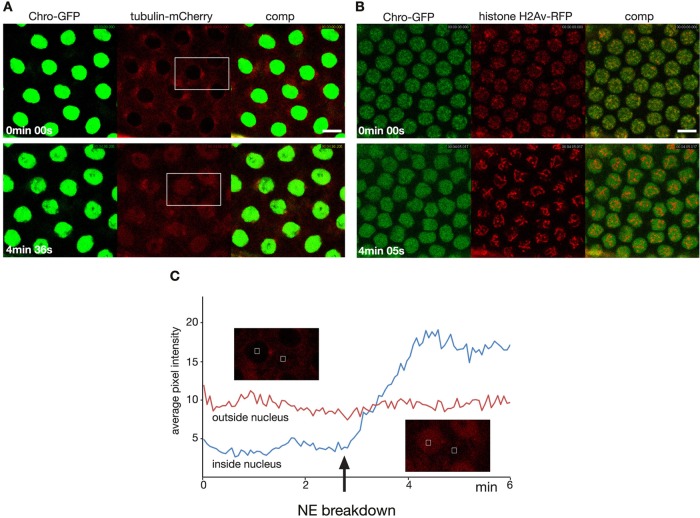
FIGURE 2:
Spindle matrix dynamics after colchicine injection before nuclear envelope breakdown. (A) Two image panels from the beginning and end of a time-lapse sequence of Chromator-GFP (green) and tubulin-mCherry (red) after colchicine injection. (B) Two image panels from the beginning and end of a time-lapse sequence of Chromator-GFP (green) and histone H2Av-RFP (red). (C) Plot of the average pixel intensity in regions of interest (ROIs) outside the nucleus (red) and inside the nucleus (blue) as a function of time in a colchicine-injected embryo. The two image inserts correspond to the area outlined by a white boxes in A before and after NE breakdown, respectively. The ROIs are indicated by white squares. The difference in expression levels of Chromator-GFP in A and B is due to use of high- and low-expression driver lines, respectively.

