FIGURE 3:

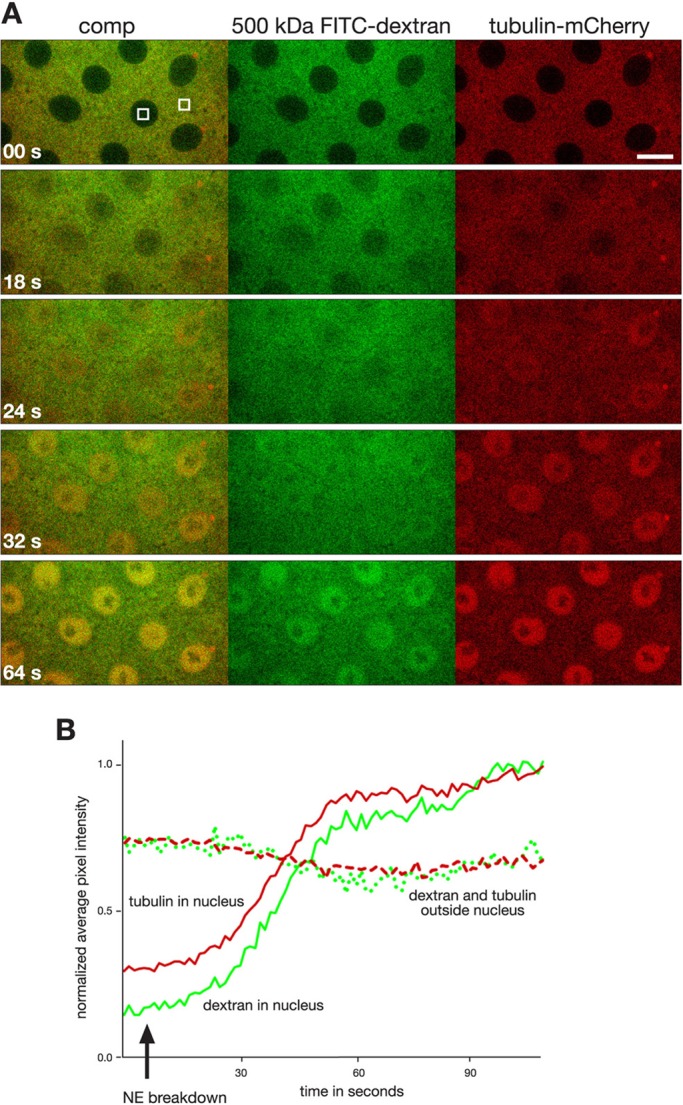
The 500-kDa dextran enters and accumulates in the nuclear space on the same timescale as tubulin in colchicine-injected embryos. (A) Image panels from a time-lapse sequence from a tubulin-mCherry (red)–expressing embryo coinjected with fluorescein-labeled dextran of molecular mass 500 kDa (green) and colchicine. Time is in seconds. Scale bar, 10 μm. (B) Plot of the normalized average pixel intensity in ROIs outside the nucleus and inside the nucleus of tubulin (red) and 500-kDa dextran (green) as a function of time in a colchicine-injected embryo. The solid and stippled lines correspond to areas inside and outside a nucleus, respectively, as outlined by the white boxes in A. The approximate time of NE breakdown is indicated by an arrow.
