FIGURE 6:
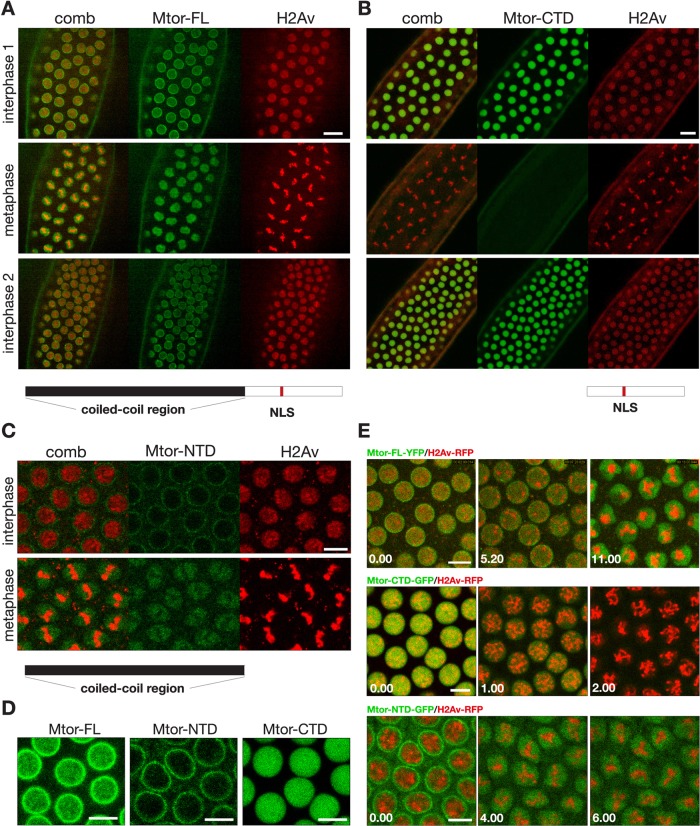
Time-lapse analysis of the spindle matrix protein Megator in syncytial embryos. (A) Relative dynamics of full-length Megator-YFP (Mtor-FL) and histone H2Av-RFP (H2Av) during a complete mitotic cycle. The images show their distribution at interphase 1, metaphase, and interphase 2, respectively. The diagram beneath the images shows the domain structure of Megator with the coiled-coil region in black, the CTD in white, and the endogenous NLS in red. Scale bar, 20 μm. (B) Relative dynamics of a truncated, GFP-tagged, carboxy-terminal construct of Megator (Mtor-CTD) and histone H2Av-RFP (H2Av) during a complete mitotic cycle. The images show their distribution at interphase 1, metaphase, and interphase 2, respectively. Mtor-CTD is diagrammed below the images. Scale bar, 20 μm. (C) Relative dynamics of a truncated, GFP-tagged, amino-terminal construct of Megator (Mtor-NTD) and histone H2Av-RFP (H2Av) during interphase and metaphase. Mtor-NTD is diagrammed below the images. Scale bar, 10 μm. (D) The localization patterns of Mtor-FL, Mtor-NTD, and Mtor-CTD at interphase. Mtor-FL localizes to the nuclear interior, as well as to the nuclear rim, Mtor-NTD is present at the nuclear rim with no or very little interior nuclear localization, and Mtor-CTD is diffusively present in the nucleoplasm without detectable nuclear rim localization. (E) Top, three images from a time-lapse sequence of Mtor-FL-YFP (green) and histone H2Av-RFP (red) after colchicine injection at interphase. Middle, three images from a time-lapse sequence of Mtor-CTD-GFP (green) and histone H2Av-RFP (red) after colchicine injection at interphase. Bottom, three images from a time-lapse sequence of Mtor-NTD-GFP (green) and histone H2Av-RFP (red) after colchicine injection at interphase. Time is in minutes and seconds. Scale bars, 10 μm.

