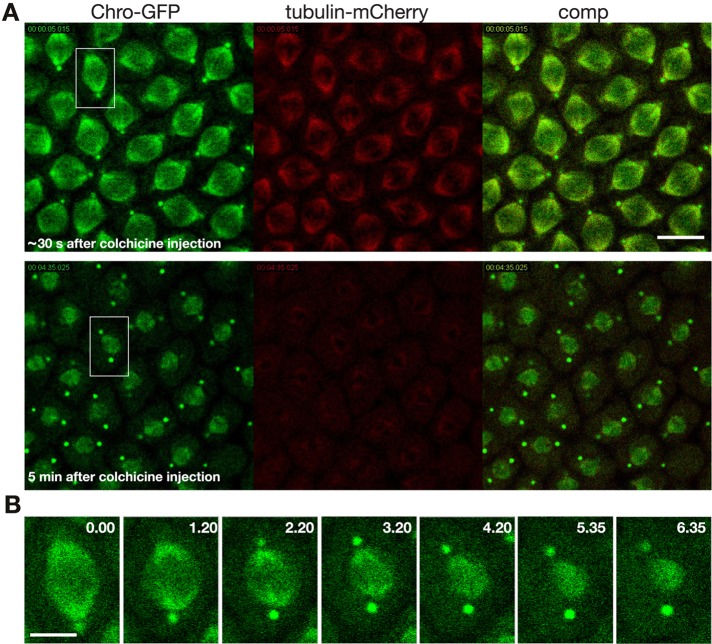
FIGURE 7:
Depolymerization of microtubules at metaphase leads to contraction of the spindle matrix. (A) Two image panels from the beginning and end of a time-lapse sequence of Chromator-GFP (green) and tubulin-mCherry (red) after colchicine injection. The image sequence begins ∼30 s after colchicine injection. Scale bar, 10 μm. (B) Image sequence of Chromator-GFP after colchicine injection in the spindle outlined by white rectangles in A. Time is in minutes and seconds. Scale bar, 5 μm.

