FIGURE 5:
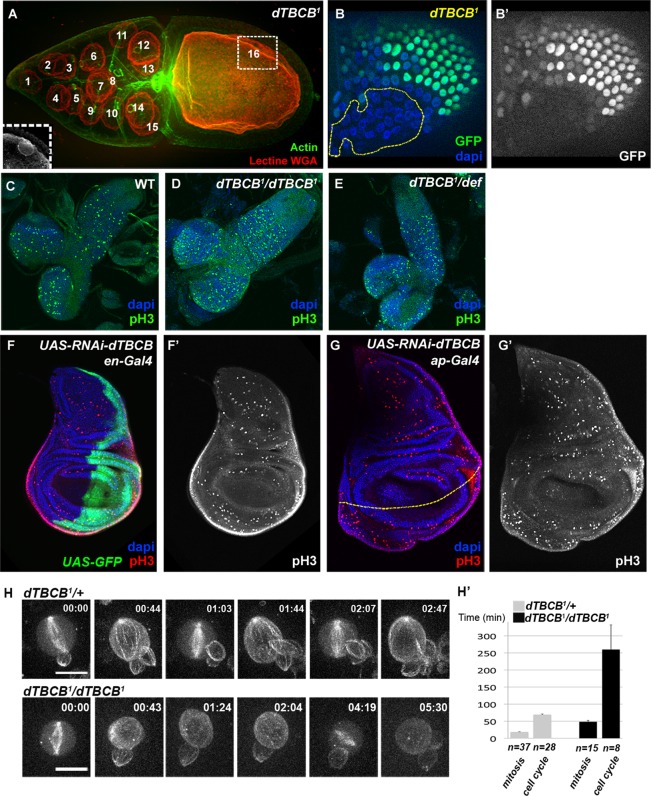
dTBCB is not essential for cell proliferation but modulates cell cycle duration during development. (A) dTBCB1 mutant stage 10 germ-line cyst. Nuclei were detected with WGA lectin (red). Actin labeling (green) reveals cellular outline. The 16 nuclei of the cyst are numbered. The oocyte nucleus (numbered 16) is in a different focal plane, which is shown in the inset. (B and B′) Cell proliferation is not impaired in dTBCB1 mutant follicle cells. A large dTBCB1 mutant follicle cell clone, GFP negative, is highlighted by a yellow dashed line. DNA is shown in blue and GFP in green and white. (C–E) Immunostainning of second-instar larval brains. Mitosis is detected with a pH3 antibody (green). DNA is shown in blue. (C) Wild type, (D) dTBCB1/dTBCB1: homozygous larvae, (E) dTBCB1/Def: larvae carrying one copy of dTBCB1 over a deficiency removing the dTBCB locus. (F–G′) Immunostainning of third-instar larval wing disks. Mitosis is detected with a pH3 antibody (red and white). DNA is shown in blue. (F–F′) UAS-RNAi-dTBCB flies combined with en-Gal4. (F) The expression domain of en-Gal4 at the posterior side is revealed by a UAS-GFP transgene (green). (G–G′) UAS-RNAi-dTBCB flies combined with ap-Gal4. (G) The dorso-ventral border of the wing disc is highlighted by a yellow dashed line. The expression domain of ap-Gal4 at the dorsal compartment stands at the upper side of the line. (H–H′) Selected time-lapse series of neuroblasts from cultured larval explant brains expressing the Ubi-α-RFP-tubulin transgene. Successive cell cycles are shown for the dTBCB1/+ control and the homozygous dTBCB1 mutant neuroblasts, with consecutive mitosis (frames 1, 3, and 5 for the control; frames 1 and 5 for the mutant). In the mutant conditions, the laser was increased for better visualization of MTs. (H′) Comparison of either cell cycle length (between two successive nuclear breakdowns) or mitosis length (nuclear breakdown to cytokinesis) in dTBCB1/+ control and homozygous dTBCB1mutant neuroblasts. n corresponds either to the number of mitoses or to the number of cell cycles. For dTBCB1/+, 10 independent cells were analyzed, and for homozygous dTBCB1, 20 independent cells were analyzed. Time stamp is hh:mm. Scale bar: 10 μm.

