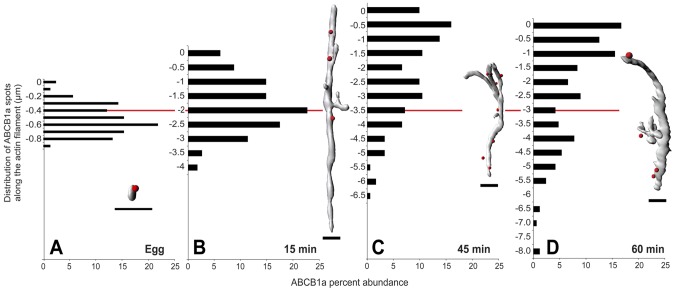
FIGURE 4:
Three-dimensional analysis of ABCB1a dispersal relative to F-actin filaments indicates efflux activation is mediated by short-range, actin-dependent translocation. F-actin–associated ABCB1a advances tip-ward after fertilization (A–D). Bars indicate percent of ABCB1a spots within 200 nm of actin surface, and zero (y-axis) indicates the tip of the microvillus (n = 6 eggs or embryos × 10 filaments per time). Red line indicates the average microvillar length at each time. Insets, representative actin filament isosurfaces and associated ABCB1a spots (red). Scale bar: 1 μm.

