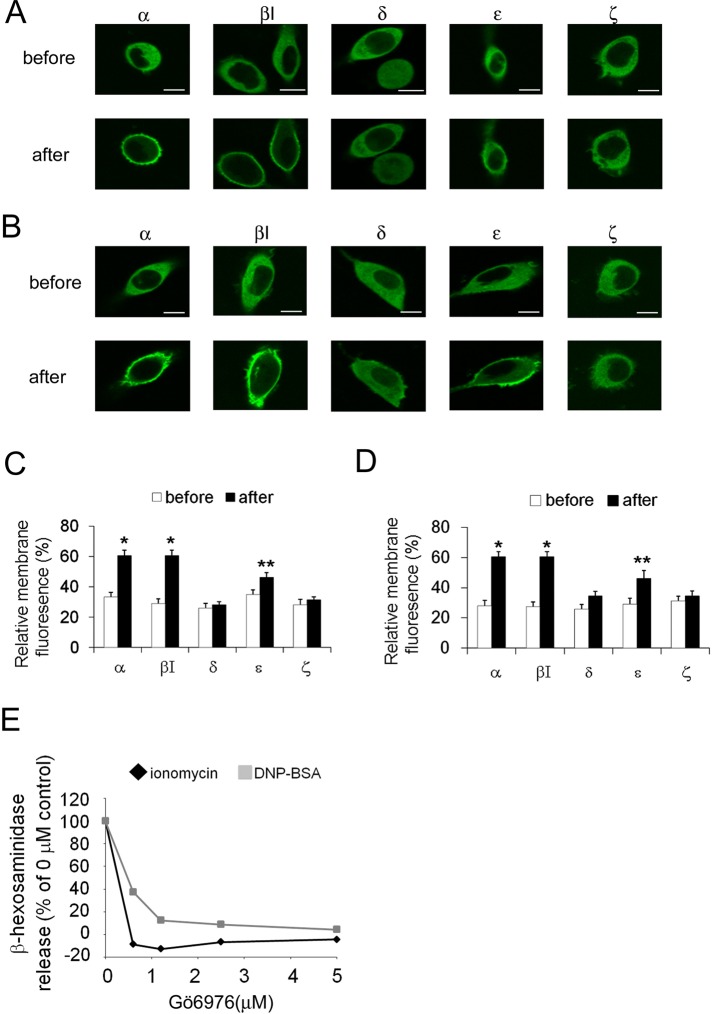
FIGURE 1:
The translocation of PKCs during degranulation. Translocation of GFP-PKCs in RBL-2H3 cells induced by ionomycin (A) or antigen (B). RBL-2H3 cells overexpressing GFP-tagged PKCα, βI, δ, ε, or ζ were stimulated with 1 μM ionomycin or 50 ng/ml DNP-BSA (antigen). The translocation of GFP-PKCs was monitored using confocal microscopy. Bars, 10 μm. (C, D) Statistical analysis of membrane translocation. The average percentage of the membrane fluorescence of total fluorescence is represented as the relative membrane fluorescence with SD. Open and closed columns show the results before and after ionomycin (C) or DNP-BSA (D) stimulation, respectively (**p < 0.1, *p < 0.05). (E) The effect of the cPKC inhibitor Gö6976 on antigen- or ionomycin-induced degranulation. RBL-2H3 cells were incubated for 15 min with different concentrations of Gö6976 and then stimulated with either 50 ng/ml DNP-BSA or 1 μM ionomycin for 15 min. The percentage of β-hexosaminidase release is plotted.

