FIGURE 5:
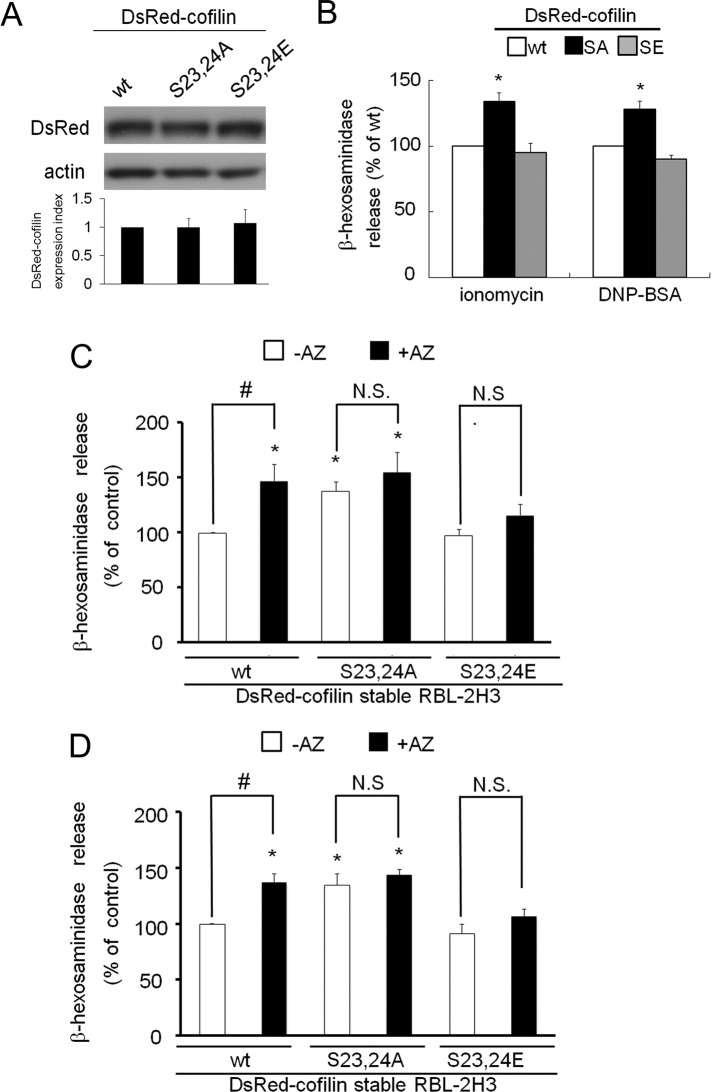
The effect of expression of cofilin mutants on degranulation. (A) Western blotting analyses of the expression of DsRed-cofilin WT and the S23,24A and S23,24E mutants. Approximately 50 μg of protein from each cell line stably expressing wild-type, S23,24A, or S23,24E was subjected to SDS–PAGE and Western blotting with anti-DsRed (top) and anti-actin (bottom) antibodies. After measuring the density of immunoreactive bands with ImageJ software (National Institutes of Health, Bethesda, MD) and normalizing the cofilin immunoreactive signal to that of actin, an average value ± SD was plotted in the bottom graph. (B) Each stable cell line was stimulated with 1 μM ionomycin or 50 ng/ml DNP-BSA for 15 min, and the percentage of β-hexosaminidase release was plotted. (C, D) After pretreatment with 10 μM azelastine or no treatment, each stable cell line was stimulated with 1 μM ionomycin (C) or 50 ng/ml DNP-BSA (D) for 15 min; the percentage of β-hexosaminidase release was plotted. Asterisk indicates a significant difference relative to control release (WT, –AZ) with p < 0.05; number sign indicates difference between control (–AZ) and test (+AZ) with p < 0.05; AZ, azelastine; N.S., not significant. All experiments were performed in triplicate; error bars indicate SD.

