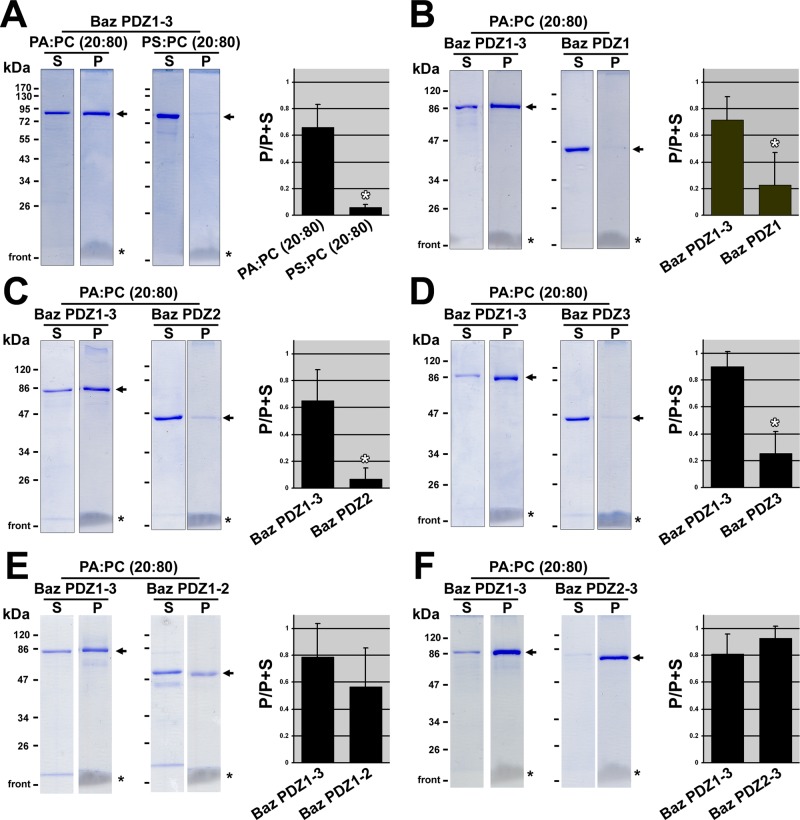
FIGURE 2:
Preferential binding of tandem Bazooka PDZ domains to phosphatidic acid in liposomes. Use of 10% SDS–PAGE and staining with Coomassie brilliant blue shows the distribution of GST-PDZ proteins (arrows) between the supernatant (S) and the liposome pellet (P) after liposome-binding assays. Equal proportions of the supernatants and pellets were loaded. Lanes with the same markers were cropped from the same gels. Note the migrating lipids at the base of the pellet lanes (asterisks). Quantifications of three separate binding assays are shown to the right. The Coomassie-stained bands were quantified in ImageJ, and the proportion of the total protein in the pellet is shown. Means shown with standard deviations. White asterisks indicate statistically significant differences (p < 0.01; t tests). (A) Baz PDZ1-3 binds PA more strongly than PS. (B) PA binds Baz PDZ1-3 more strongly than Baz PDZ1. (C) PA binds Baz PDZ1-3 more strongly than Baz PDZ2. (D) PA binds Baz PDZ1-3 more strongly than Baz PDZ3. (E) PA binds Baz PDZ1-3 and Baz PDZ1-2 similarly. (F) PA binds Baz PDZ1-3 and Baz PDZ2-3 similarly.

