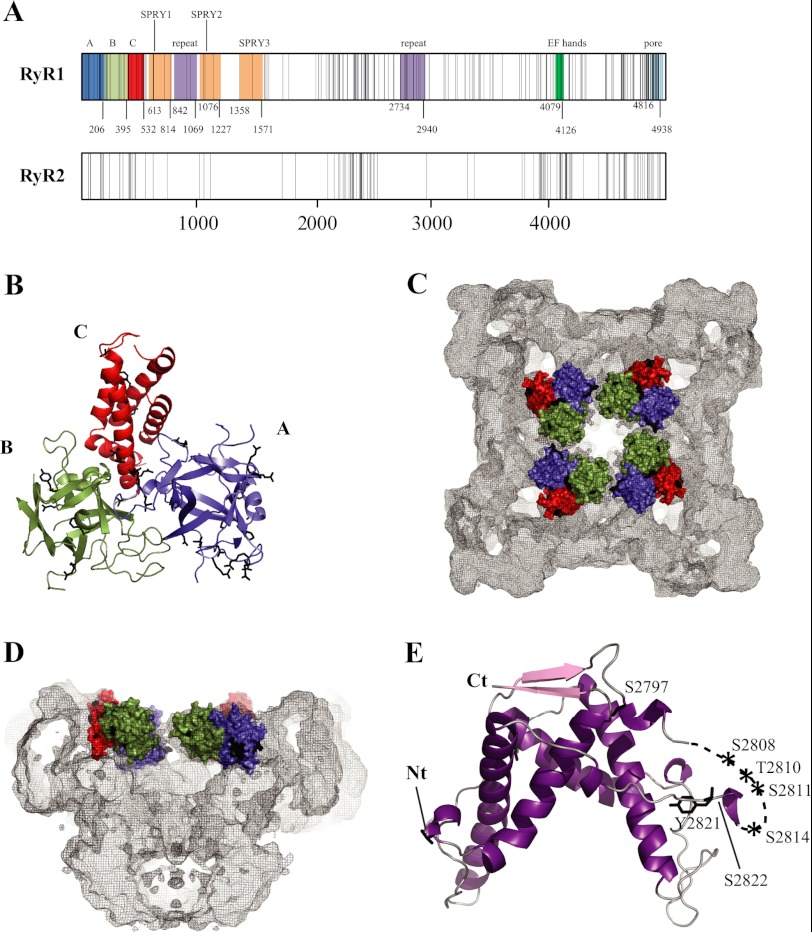
FIGURE 4.
Disease hot spots. A, linear view of the RyR sequences, with each vertical line representing a disease mutation. The shaded areas indicate experimentally verified (domains A–C) and some key predicted domains. Another truncated repeat may be present between SPRY2 and SPRY3 (not shown). The domain boundaries are numbered according to the RyR1 sequence. Except for domains A–C, the numbering is only a prediction and may vary (Ref. 97 and the Phyre2 server, Structural Informatics Group, Imperial College London). The predicted pore-forming area is based on homology to the pore-forming region of a bacterial voltage-gated sodium channel (Protein Data Bank code 3RVZ). B, crystal structure of the RyR1 ABC region (Protein Data Bank code 2XOA) (93). Disease mutations are shown as black sticks. Mutations in flexible loops have been omitted for clarity. C and D, location of the RyR1 ABC domains in the RyR1 cryo-EM map. The domains are shown in surface representation. Black patches correspond to the locations of disease mutations. Shown are a view from the cytoplasm (C) and a side view with one-half omitted (D). E, crystal structure of the RyR2 phosphorylation domain. The labels indicate phosphorylation target sites within the phosphorylation loop.

