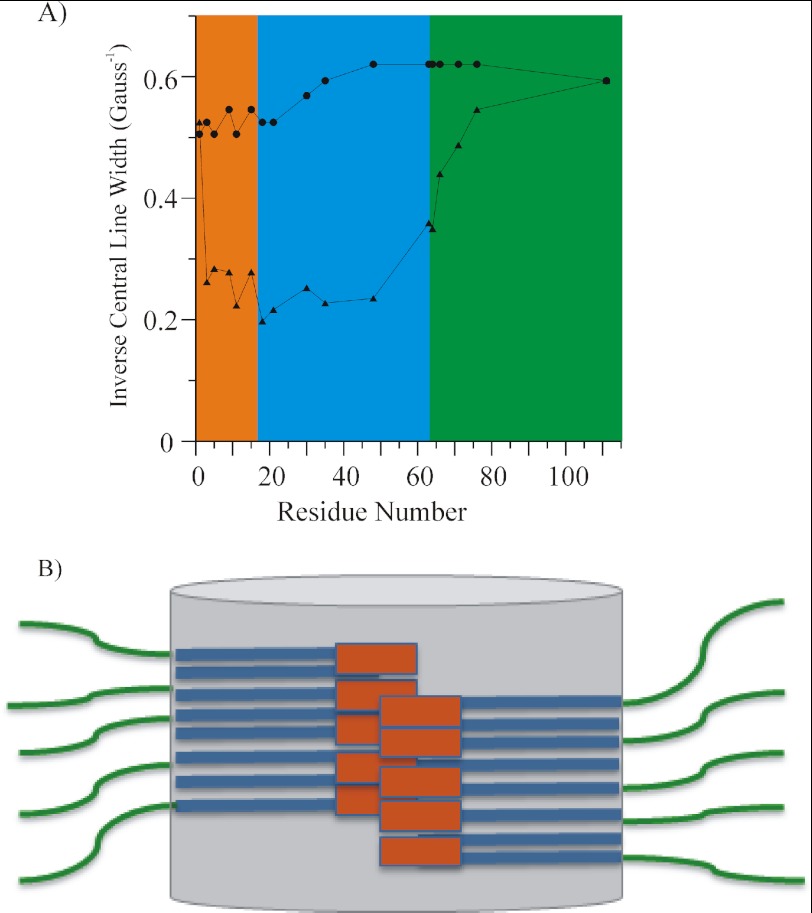
FIGURE 5.
A, inverse central line width from EPR spectra of HDx1 fusion protein (circles) and sparsely labeled fibrils (triangles). The inverse of the width of the central resonance line is plotted as function of residue number to give a measure of mobility. Individual domains are highlighted. The orange, blue, and green shaded regions represent the N-terminal, polyQ, and C-terminal domains, respectively. B, sketch of the domain organization within HDx1 fibrils. The N termini (orange) and polyQ (blue) form the fibril core region (gray cylinder), from which the solvated, highly mobile C termini (green) protrude. The polyQ region is represented as generic stacked rectangles and is not meant to imply any statement about the actual number or arrangement of individual β-strands. Whether the N-terminal region is located at the center or the periphery of the core region is unknown.

