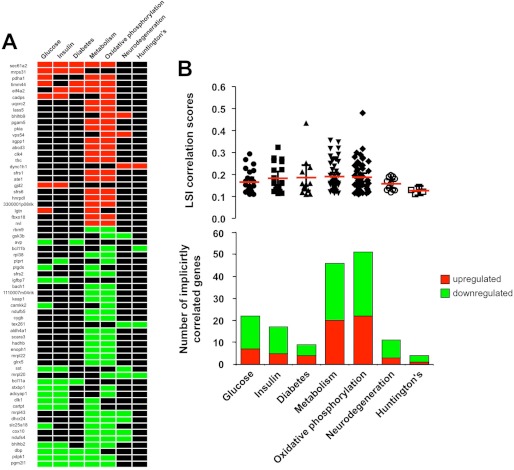
FIGURE 2.
Genomic correlations in the hypothalamic N171–82Q HD mouse transcriptomic signature. A, genomic heat map representation of the significantly regulated transcripts that possess an implicit semantic correlation (LSI score >0.1) with at least two of the user-defined input interrogator terms (glucose, insulin, diabetes, metabolism, oxidative phosphorylation, neurodegeneration, and Huntington disease). Red blocks indicate the correlation of a correlated gene up-regulated in HD compared with WT controls, and green blocks indicate the correlation of a down-regulated HD-associated gene. Black blocks indicate no significant gene-LSI interrogator term correlation. B, upper panel indicates the mean (red bar) ± S.E. LSI correlation score from all the specifically correlating HD-associated genes with the input LSI interrogator terms. The lower panel displays the numbers and direction of transcript regulation of HD-associated genes correlating with the specific LSI interrogator terms.

