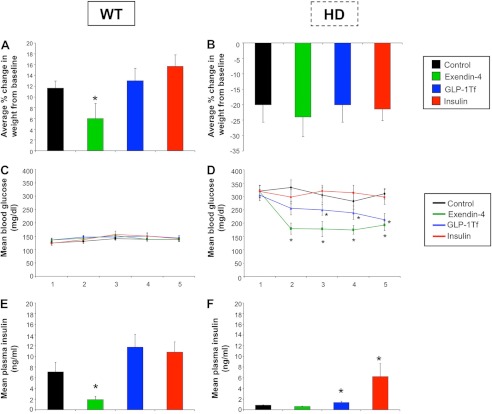
FIGURE 3.
Body weight and glycemic hormone levels are altered by Ex-4, GLP-1-Tf, or insulin treatments. Average % change in body weight from base line for WT (A) and HD (B) mice throughout the study. Mean blood glucose concentrations for WT (C) and HD (D) mice throughout the study. Mean plasma insulin concentrations in WT (E) and HD (F) mice. Values are mean ± S.E. *, p ≤ 0.05; n = 10 per group.

