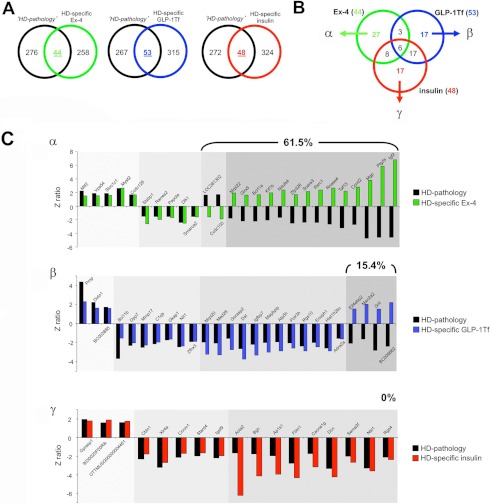
FIGURE 8.
Euglycemic agents can reverse hypothalamic HD transcriptomic pathology to different degrees. Isolation of significantly regulated genes common between the HD mouse hypothalamic pathology set (black circles, HD pathology) and the HD-specific, Ex4- (green circle), GLP-1-Tf- (blue circle), or insulin (red circle)-regulated transcriptomic sets (A). Venn diagram isolation of Ex-4/GLP-1-Tf/insulin-unique HD pathology-related genes. Ex-4-unique HD pathology-related Geneset is designated α, GLP-1-Tf-unique HD pathology-related Geneset is designated β, and insulin-unique HD pathology-related Geneset is designated γ (B). C, z ratio distributions of α, β, and γ Geneset constituents. HD pathology-regulated genes are denoted in black, and the drug-dependent gene regulatory behavior is color-coded as follows: green bars, Ex-4; blue bars, GLP-1-Tf; red bars, insulin. The numerical percentage of these genes in the sets α, β, or γ that display a reversed polarity of z ratio regulation between the HD pathology data and the drug-controlled data is indicated in each panel.

